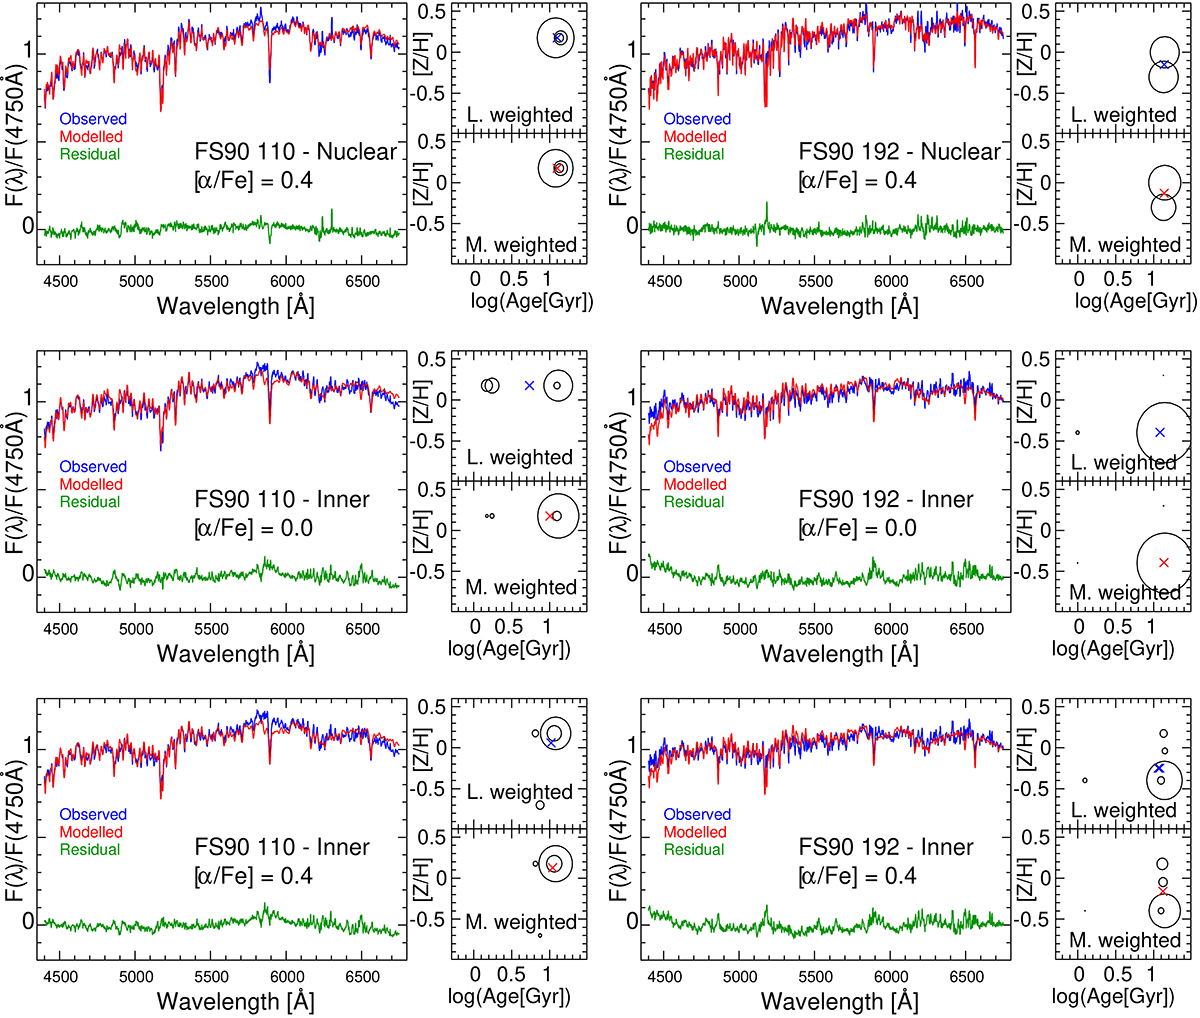
Fig. 8.
Download original image
Results from the full spectral fitting to the spectra of the cEs, by means of the code STARLIGHT, scaled to the flux at 4750 Å. Each three-panel plot corresponds to a particular spectrum and set of templates, considering two different [α/Fe] enhancements (see the text for further details). The blue curve represents the observed spectrum and the modelled one is displayed in red, with the residuals in green. The small panels to the right of each spectrum correspond to the age–metallicity distribution of the fitted SSPs, with the size of the circles representing the contribution that each SSP has in the luminosity-weighted (upper panel) and mass-weighted (lower panel) calculus. The crosses correspond to the weighted means for each case.
Current usage metrics show cumulative count of Article Views (full-text article views including HTML views, PDF and ePub downloads, according to the available data) and Abstracts Views on Vision4Press platform.
Data correspond to usage on the plateform after 2015. The current usage metrics is available 48-96 hours after online publication and is updated daily on week days.
Initial download of the metrics may take a while.