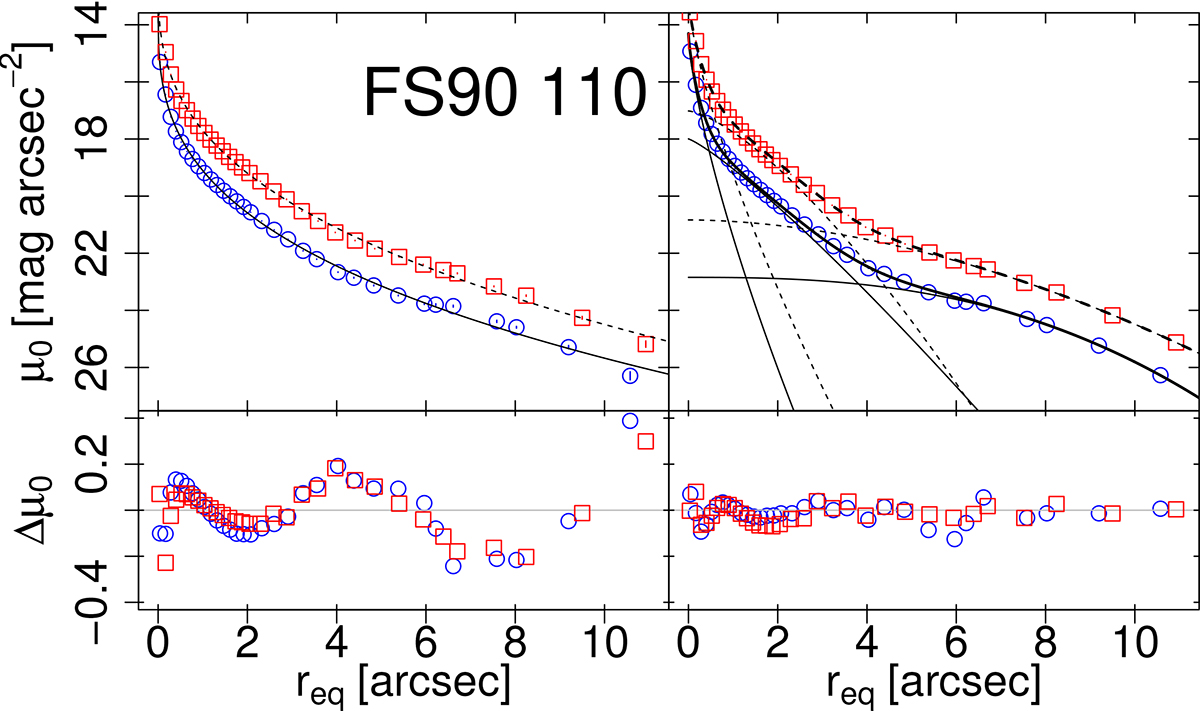
Fig. 2.
Download original image
Analysis of the surface brightness profiles for FS90 110. Left panels: upper panel presents the surface brightness profiles for FS90 110 in the B (blue circles) and I (red squares) filters. The solid and dashed curves represent the fit of single Sérsic laws. The lower panel illustrates the residuals from these fits for each filter. Right panels: surface brightness profiles for FS90 110 are fitted with three different components, each represented by a Sérsic law. The thin curves depict the individual components, while the thick ones represent their sum. The lower panel displays the residuals from the three-component fit for each filter.
Current usage metrics show cumulative count of Article Views (full-text article views including HTML views, PDF and ePub downloads, according to the available data) and Abstracts Views on Vision4Press platform.
Data correspond to usage on the plateform after 2015. The current usage metrics is available 48-96 hours after online publication and is updated daily on week days.
Initial download of the metrics may take a while.