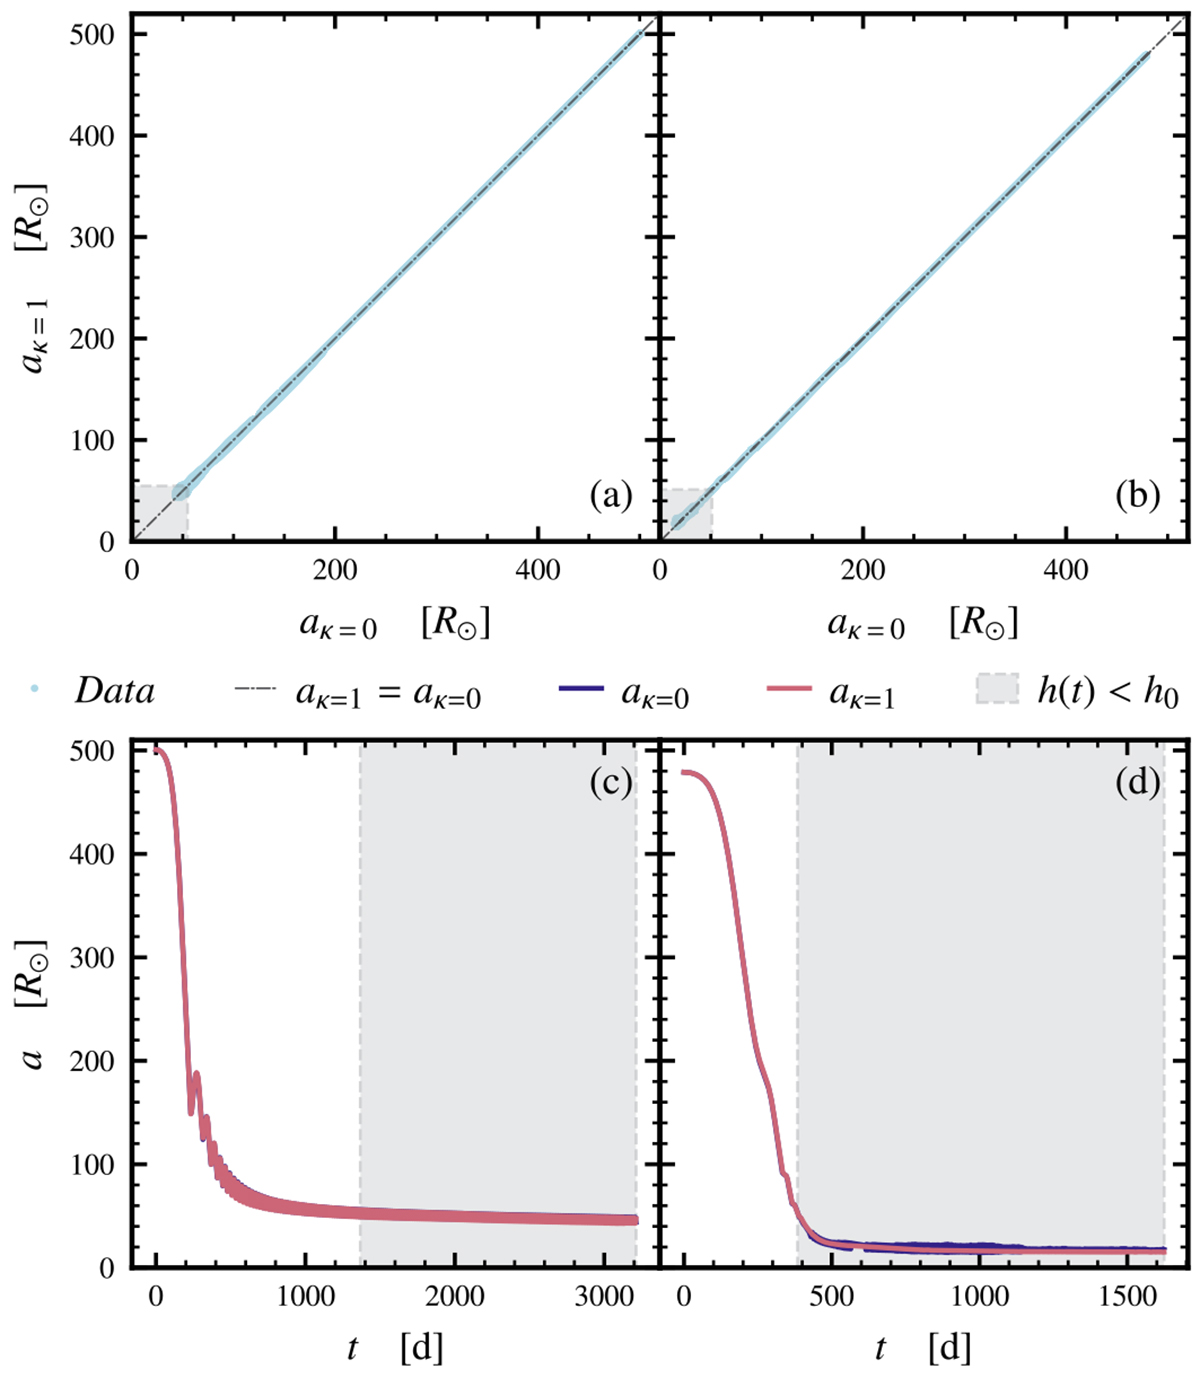
Fig. B.1.
Download original image
Comparison between the orbital separations in our simulation with κ = 1 and the fiducial model with κ = 0 (Moreno et al. 2022), for the simulation involving the BH (left panel) and NS (right panel) companion, respectively. In (a) and (b) a scatter plot of the orbital separations (aκ = 1 and aκ = 0) is shown. The black dashed lines represent the perfect correlation between the separations (i.e., aκ = 1 = aκ = 0), while the best linear fit is aκ = 1 ≈ 0.998 × aκ = 0 (≈0.995 × aκ = 0) for the BH (NS) companion. In the bottom row (c and d), we show the zoomed in temporal evolution of the orbital separations for κ = 0 (red) and κ = 1 (blue) similar to Fig. 1.
Current usage metrics show cumulative count of Article Views (full-text article views including HTML views, PDF and ePub downloads, according to the available data) and Abstracts Views on Vision4Press platform.
Data correspond to usage on the plateform after 2015. The current usage metrics is available 48-96 hours after online publication and is updated daily on week days.
Initial download of the metrics may take a while.