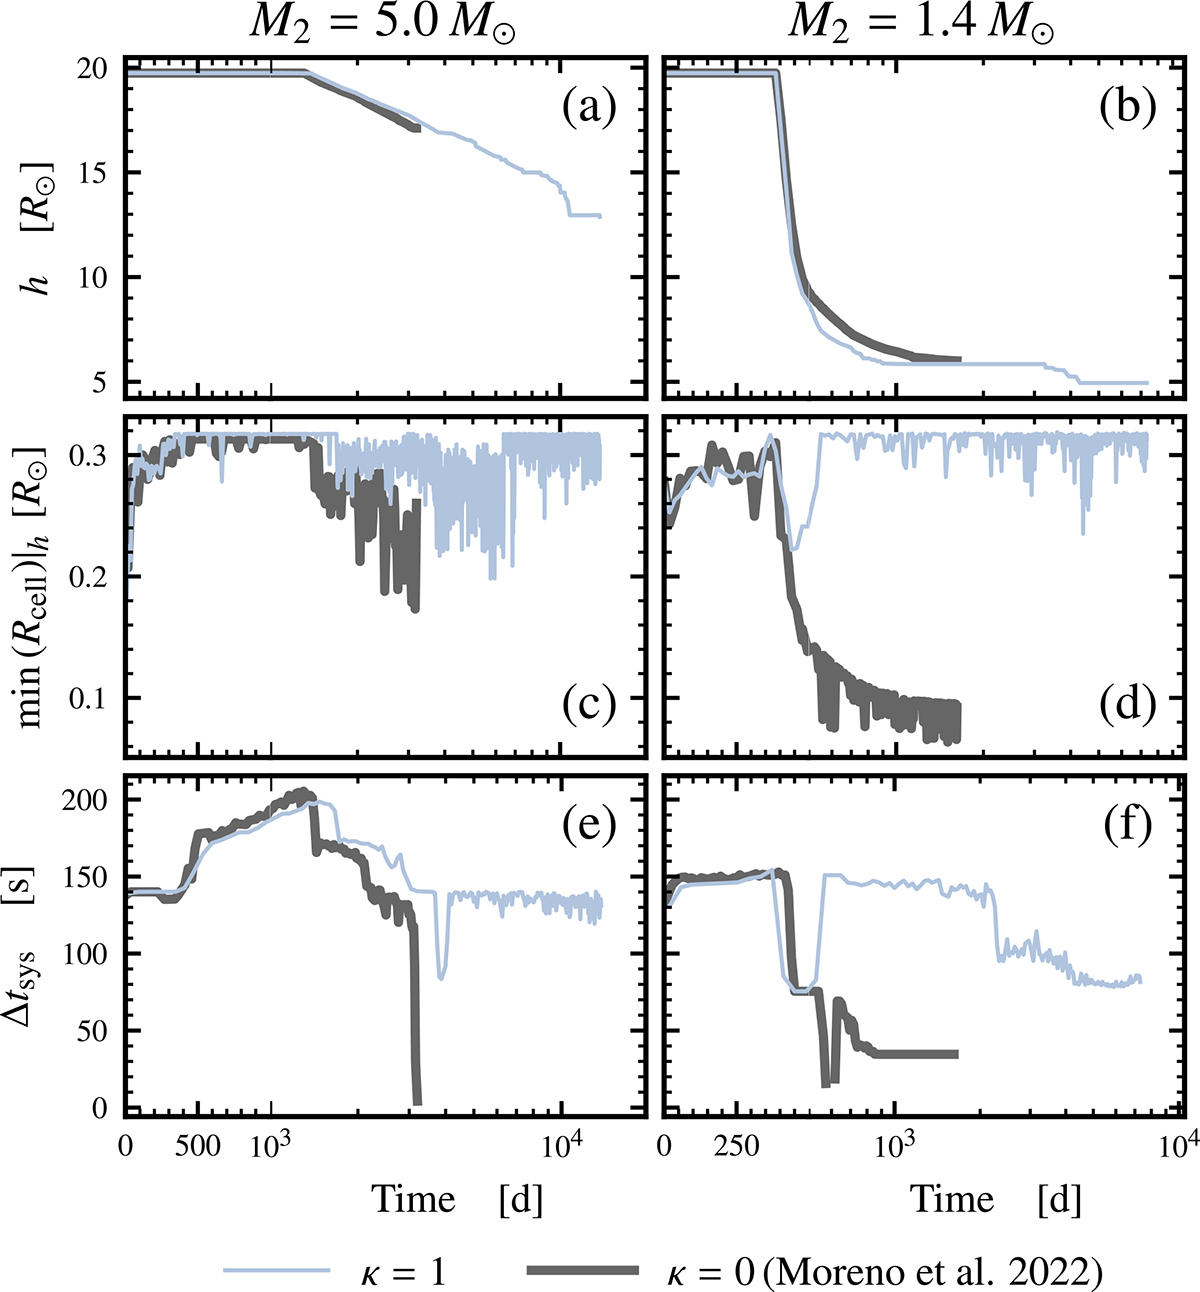
Fig. A.1.
Download original image
Temporal evolution of the softening length h in (a) and (b), the smallest cell radius within the softened spheres min(Rcell)|h in (c) and (d) as well as the system time step Δtsys in (e) and (f). The simulations conducted with κ = 1 (see Sect. 2.3) are shown in light blue, while the simulations with κ = 0 (Moreno et al. 2022) are shown in black. The plots on the left feature the system involving a BH companion and the plots on the right the CE models involving the NS companion, respectively.
Current usage metrics show cumulative count of Article Views (full-text article views including HTML views, PDF and ePub downloads, according to the available data) and Abstracts Views on Vision4Press platform.
Data correspond to usage on the plateform after 2015. The current usage metrics is available 48-96 hours after online publication and is updated daily on week days.
Initial download of the metrics may take a while.