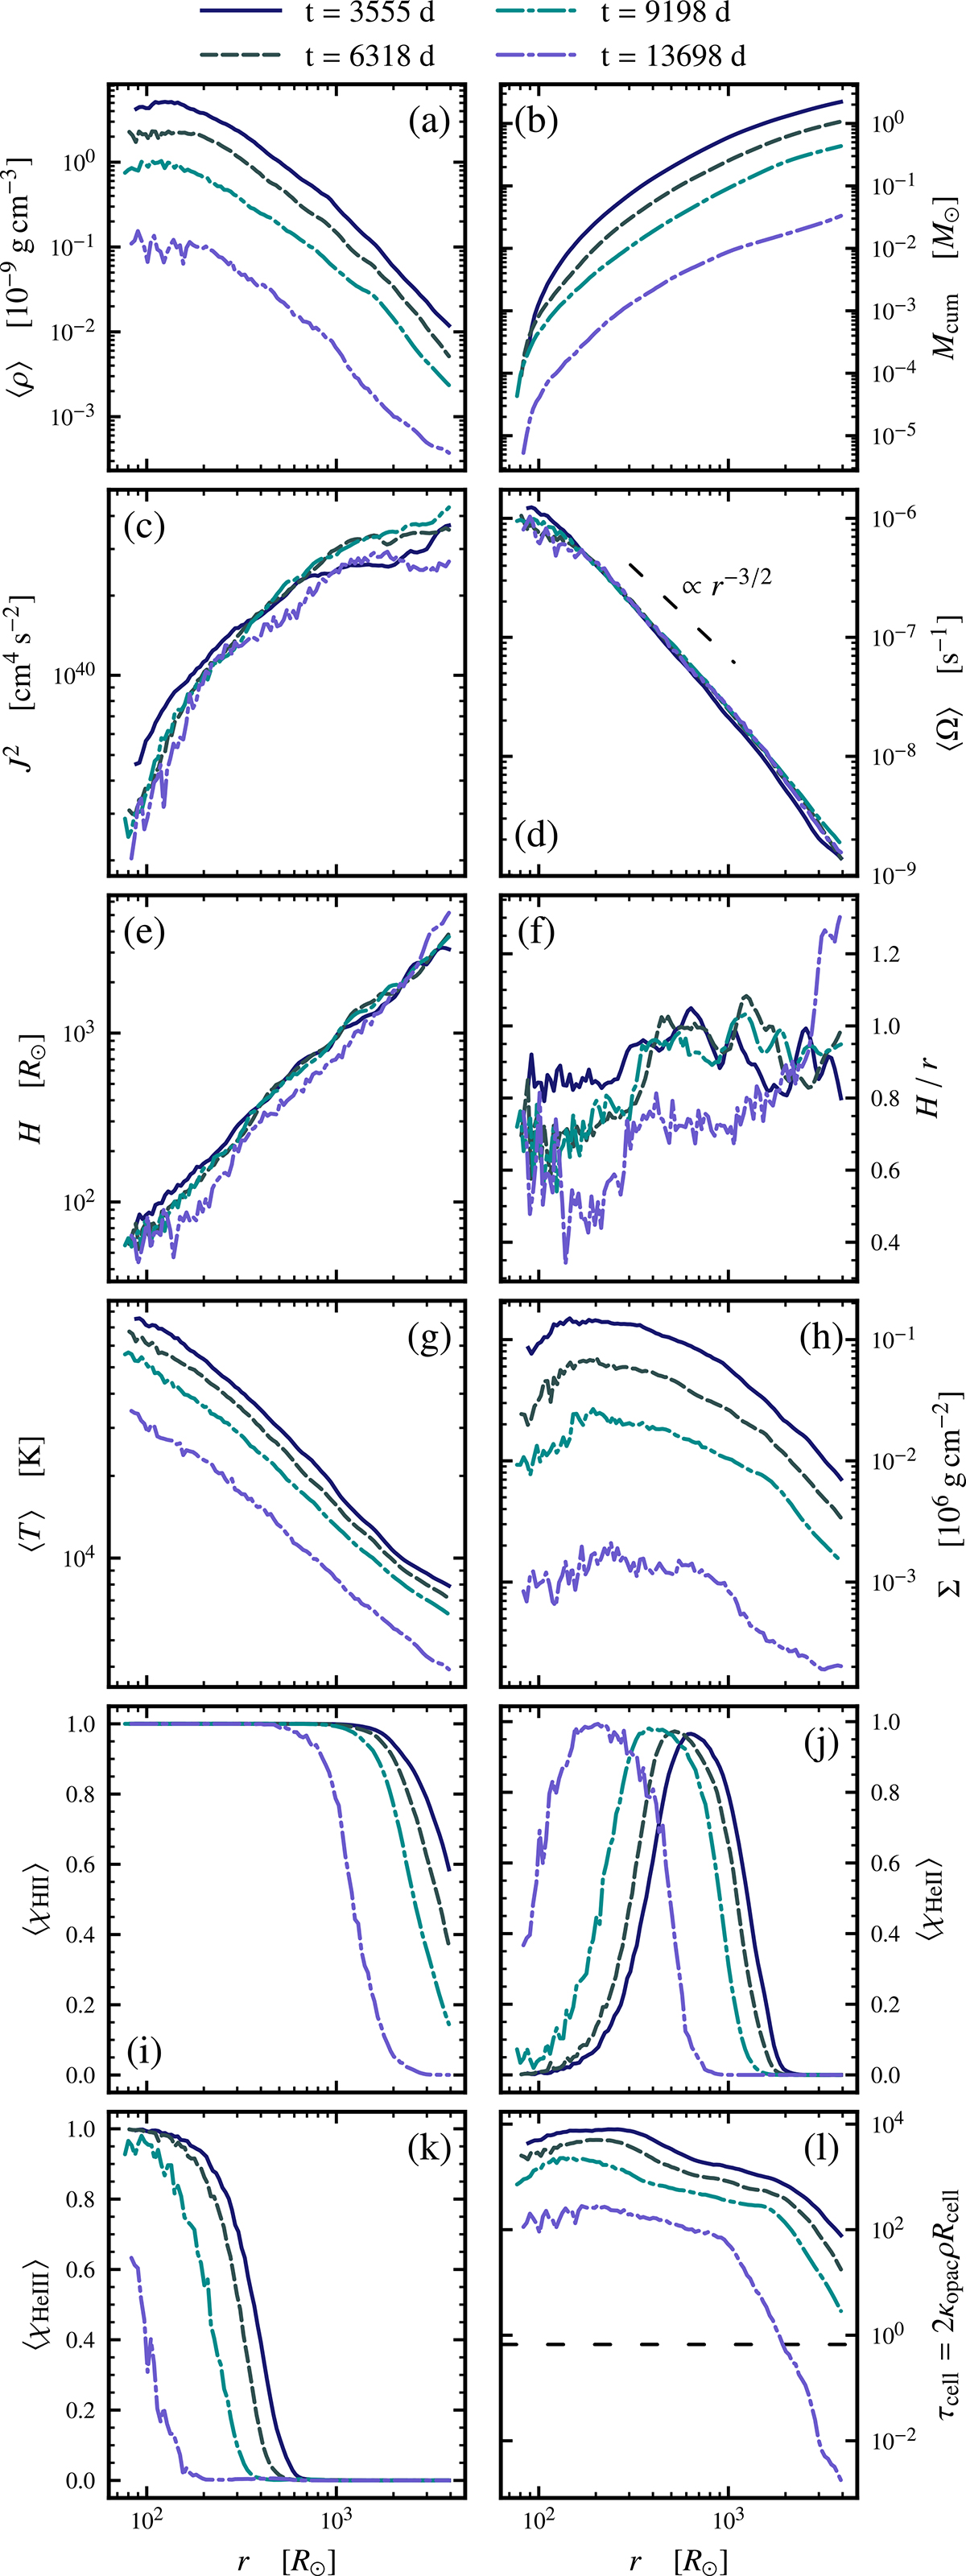
Fig. 4.
Download original image
Time evolution of averaged density ⟨ρ⟩ in (a), cumulative mass Mcum. in (b), specific angular momentum J2 in (c), angular velocity ⟨Ω⟩ in (d), isothermal pressure scale height H in (e), the aspect ratio H/r in (f), the temperature T in (g), the column density Σ in (h), the ionization fraction of HII (χHII), HeII (χHeII), and HIII (χHeIII) in (i), (j), and (k). Last, the average optical depth of cells τcell is shown in (l). The averages are taken over the range of r ∈ [2a(t), 4 × 10³ R⊙] (Sect. 3.3).
Current usage metrics show cumulative count of Article Views (full-text article views including HTML views, PDF and ePub downloads, according to the available data) and Abstracts Views on Vision4Press platform.
Data correspond to usage on the plateform after 2015. The current usage metrics is available 48-96 hours after online publication and is updated daily on week days.
Initial download of the metrics may take a while.