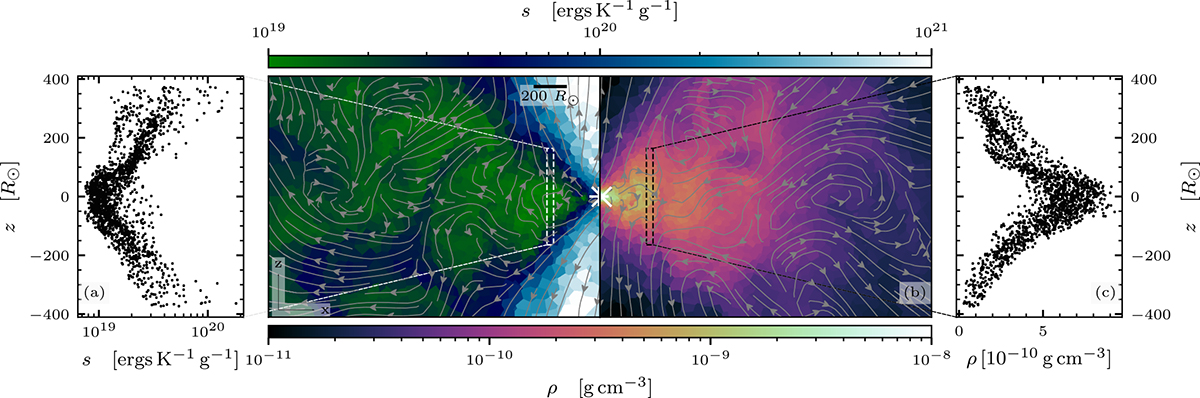
Fig. 3.
Download original image
Specific entropy s and density ρ slices of the simulation with the BH companion at t = 8244 d. The quantities are shown to the left (x ≤ 0 for the spec. entropy) and right (x ≥ 0 for the density) in an edge-on view (x − z) in (b), respectively. Furthermore, the distribution of all cells along the z-direction in a cylindrical shell (indicated by the dashed rectangle) in (a) and (c). The gray streamlines in (b) show the velocity field in the x − z plane.
Current usage metrics show cumulative count of Article Views (full-text article views including HTML views, PDF and ePub downloads, according to the available data) and Abstracts Views on Vision4Press platform.
Data correspond to usage on the plateform after 2015. The current usage metrics is available 48-96 hours after online publication and is updated daily on week days.
Initial download of the metrics may take a while.