Fig. 1.
Download original image
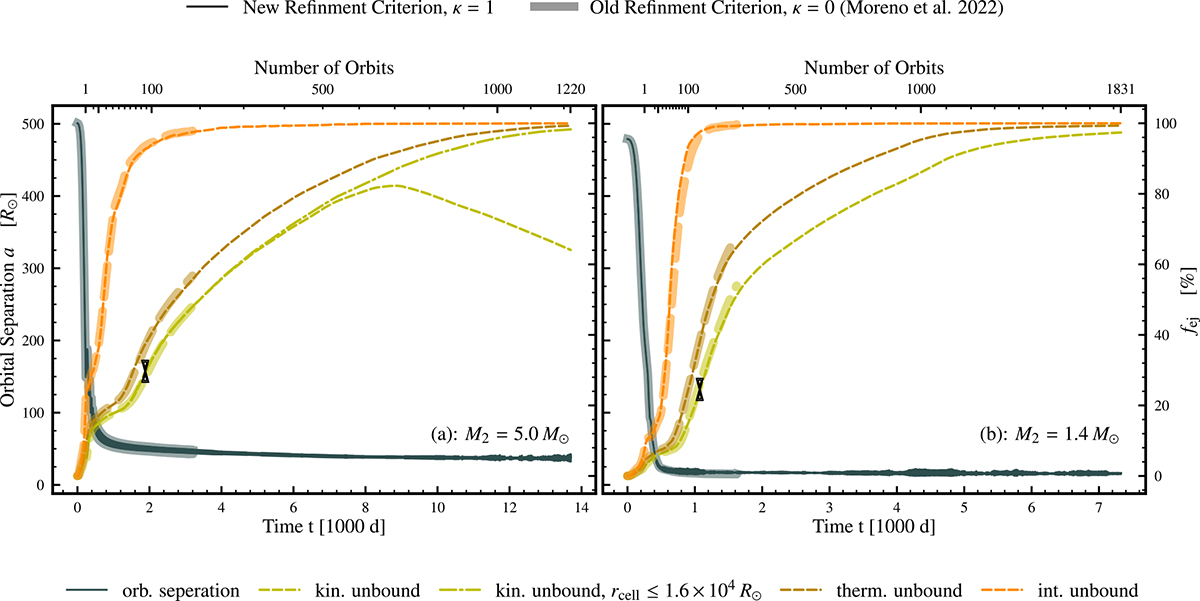
Temporal evolution of the orbital separation a (solid dark) and the fraction of unbound material fej according to the kinetic (dashed green, Eq. (1)), thermal (dashed rust, Eq. (2)), and internal energy (orange, Eq. (3)) criterion, respectively. The simulation involving the BH is shown on the left, while the NS scenario is on the right. The thin lines in the plots represent the simulations that contained the new refinement approach (see Sect. 2.3, κ = 1), while the thick, faint lines correspond to the results of Moreno et al. (2022). On the left-hand side, we additionally show the unbound mass fraction only for cells contained within a radius of R = 1.6 × 10⁴ R⊙ around the central binary due to the artificial “rebinding” (see Sect. 3.1) of material in the pseudo-vacuum for t ≥ 4400 d (see Sect. 3.1). Furthermore, the hourglass markers represent the individual starting points of the magnetically driven outflow in the simulations with κ = 1. The minor ticks in both plots in between 1 − 10 orbits are adapted for readability, and only the 5 orbit mark is shown.
Current usage metrics show cumulative count of Article Views (full-text article views including HTML views, PDF and ePub downloads, according to the available data) and Abstracts Views on Vision4Press platform.
Data correspond to usage on the plateform after 2015. The current usage metrics is available 48-96 hours after online publication and is updated daily on week days.
Initial download of the metrics may take a while.