Fig. 10.
Download original image
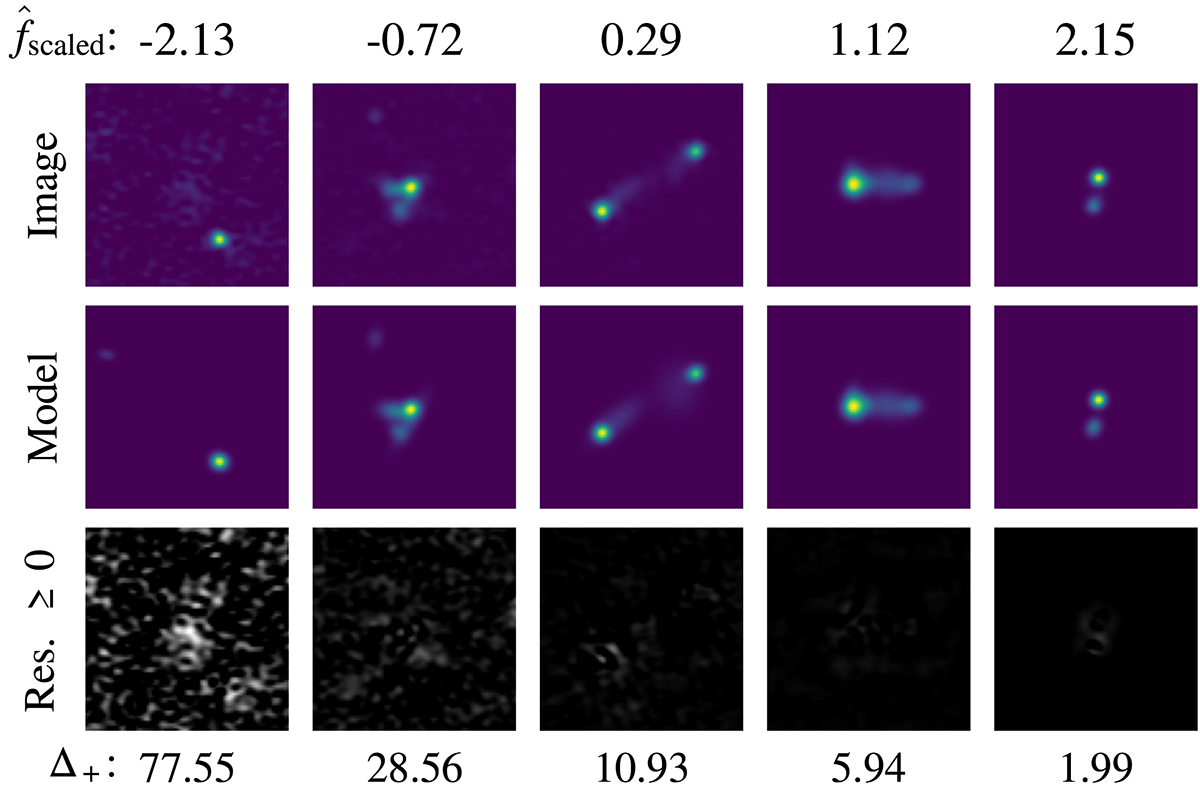
Examples of positive residuals for different values of ![]() , increasing from left to right. The top row shows the original images from the LOFAR dataset, the middle row shows the flux model, and the bottom row shows the positive residual flux. For the latter, the color values are scaled between 0 and 0.116, which is the maximum value of the depicted residuals. Values of
, increasing from left to right. The top row shows the original images from the LOFAR dataset, the middle row shows the flux model, and the bottom row shows the positive residual flux. For the latter, the color values are scaled between 0 and 0.116, which is the maximum value of the depicted residuals. Values of ![]() are indicated on top and values of Δ+ on the bottom.
are indicated on top and values of Δ+ on the bottom.
Current usage metrics show cumulative count of Article Views (full-text article views including HTML views, PDF and ePub downloads, according to the available data) and Abstracts Views on Vision4Press platform.
Data correspond to usage on the plateform after 2015. The current usage metrics is available 48-96 hours after online publication and is updated daily on week days.
Initial download of the metrics may take a while.