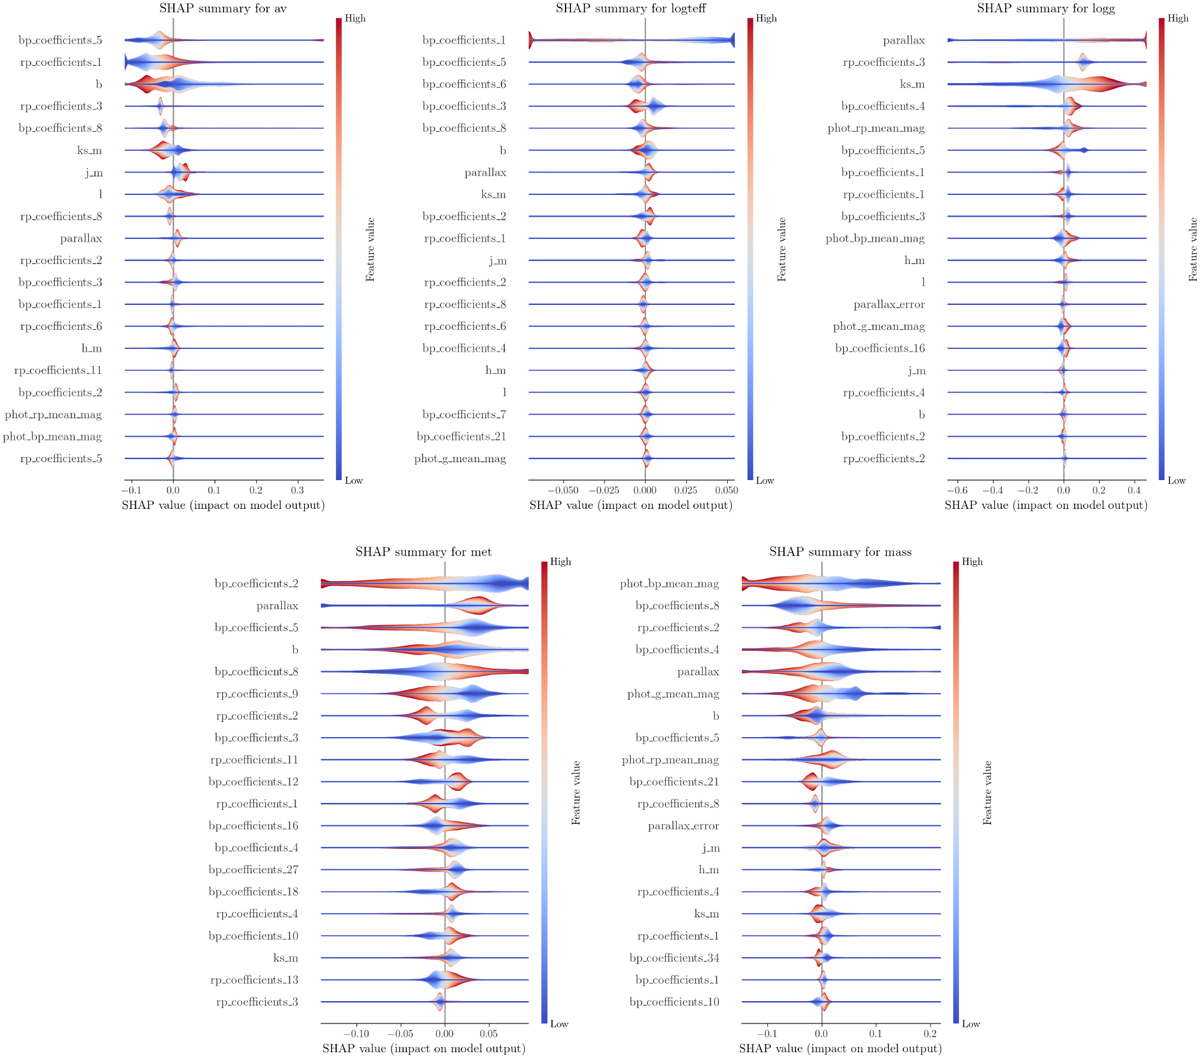
Fig. 4
Download original image
Feature importance plots for each output parameter determined with SHapley Additive exPlanation values (SHAP; Lundberg & Lee 2017). In each panel, the SHAP values for 20 000 random stars are aggregated. The rows in each panel are ordered by decreasing feature importance (from top to bottom). Only the 20 most important columns are shown; the abscissa ranges are cut to 99.8% of the SHAP value range for better visibility.
Current usage metrics show cumulative count of Article Views (full-text article views including HTML views, PDF and ePub downloads, according to the available data) and Abstracts Views on Vision4Press platform.
Data correspond to usage on the plateform after 2015. The current usage metrics is available 48-96 hours after online publication and is updated daily on week days.
Initial download of the metrics may take a while.