Fig. 3
Download original image
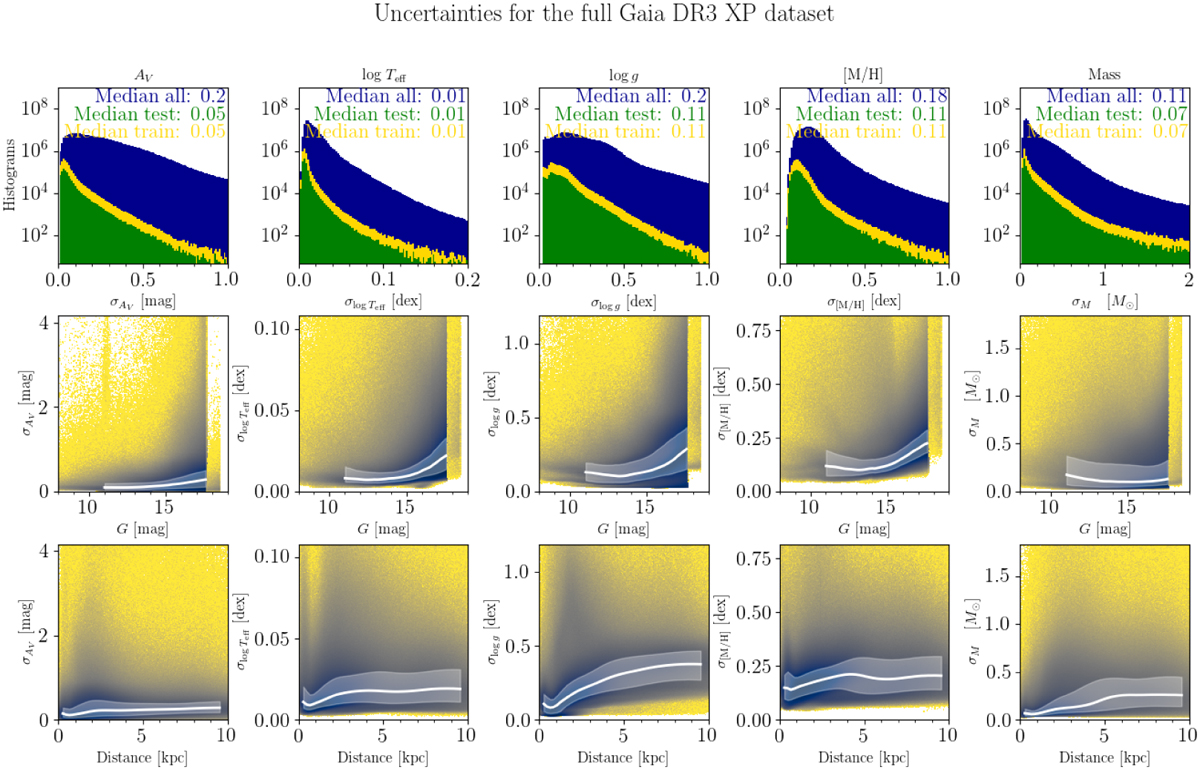
Uncertainty distributions. Top row: logarithmic histograms of the uncertainties for the training (yellow), test (green), and full Gaia DR3 XP (blue) samples. The median uncertainties are indicated in each panel. Second row: uncertainties as a function of Gaia G magnitude. Bottom row: Uncertainties as a function of distance. In the second and third row, the white lines and shaded bands show the median trends and corresponding 1σ quantiles, respectively.
Current usage metrics show cumulative count of Article Views (full-text article views including HTML views, PDF and ePub downloads, according to the available data) and Abstracts Views on Vision4Press platform.
Data correspond to usage on the plateform after 2015. The current usage metrics is available 48-96 hours after online publication and is updated daily on week days.
Initial download of the metrics may take a while.