Fig. 2
Download original image
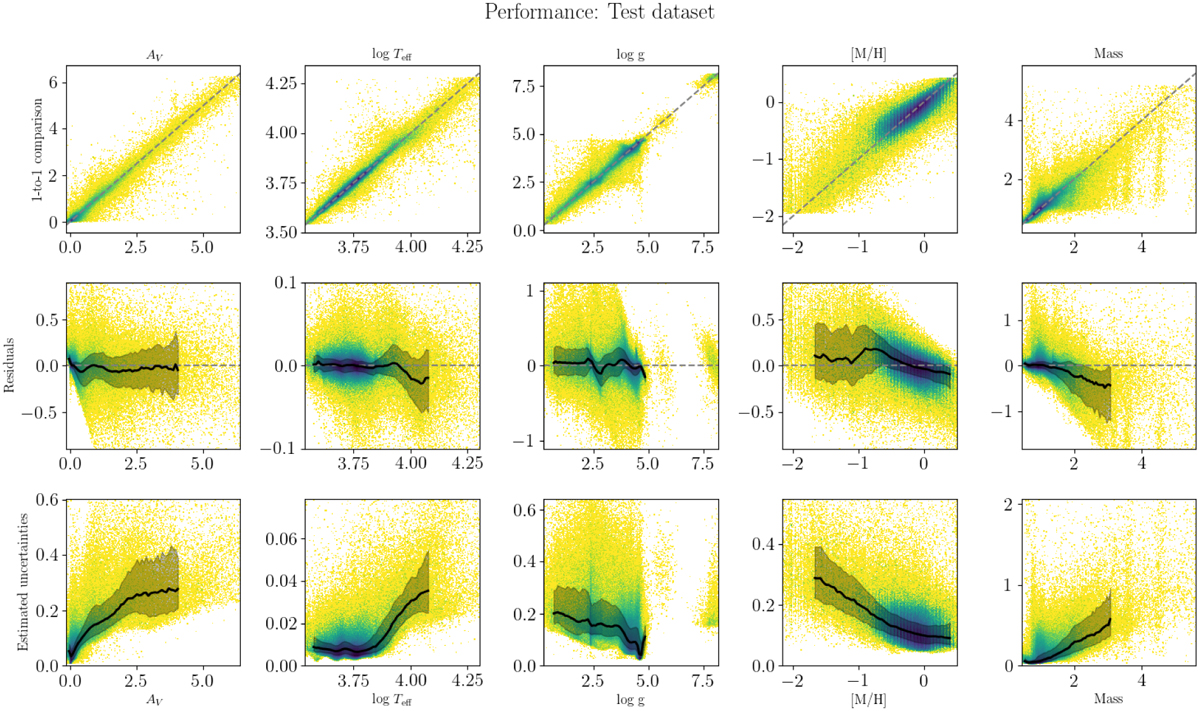
Performance of the xgboost models for the test datasets for each of the training labels. In the top row, we show the SHBoost (mean) parameters predicted from Gaia DR3, 2MASS, and AllWISE against the spectroscopic values (test labels). The middle row shows the residuals (predicted: ‘true’). The bottom row shows the formal uncertainties (derived with xgboost-distributions). Each panel contains logarithmic density plots of the full sample of 217 million stars. The lines and shaded regions in the middle and bottom rows show the running median and 1σ quantiles, respectively.
Current usage metrics show cumulative count of Article Views (full-text article views including HTML views, PDF and ePub downloads, according to the available data) and Abstracts Views on Vision4Press platform.
Data correspond to usage on the plateform after 2015. The current usage metrics is available 48-96 hours after online publication and is updated daily on week days.
Initial download of the metrics may take a while.