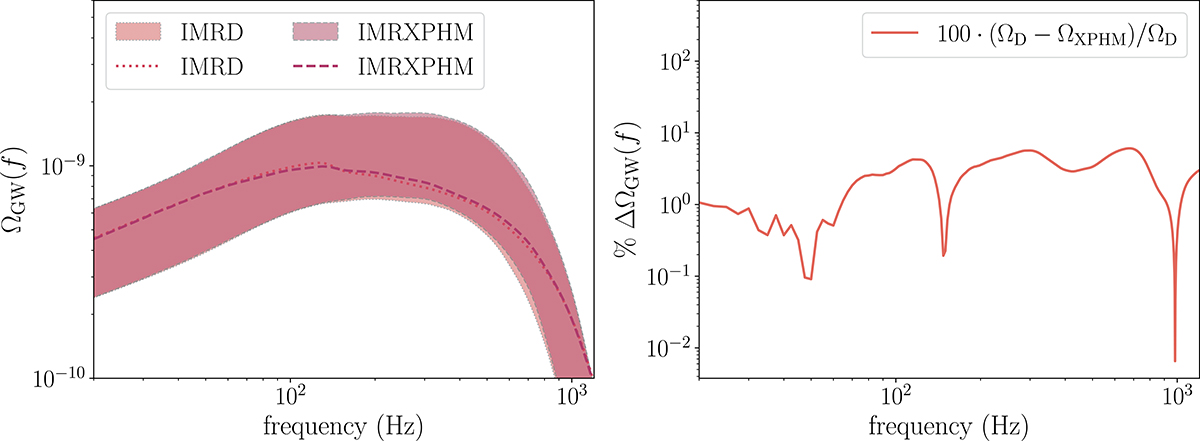
Fig. A.1.
Download original image
Impact of the inclusion of higher order modes in the waveform model employed to evaluate the ΩGW spectrum. On the left: 95% confidence on the spectrum including the uncertainty on the PLPP mass model and the local merger rate, assuming a fixed MD redshift evolution. On the right: percent difference %ΔΩGW(f) between ΩGW spectra calculated using the same event samples, shown as dashed and dotted curves on the left panel.
Current usage metrics show cumulative count of Article Views (full-text article views including HTML views, PDF and ePub downloads, according to the available data) and Abstracts Views on Vision4Press platform.
Data correspond to usage on the plateform after 2015. The current usage metrics is available 48-96 hours after online publication and is updated daily on week days.
Initial download of the metrics may take a while.