Open Access
Fig. 2.
Download original image
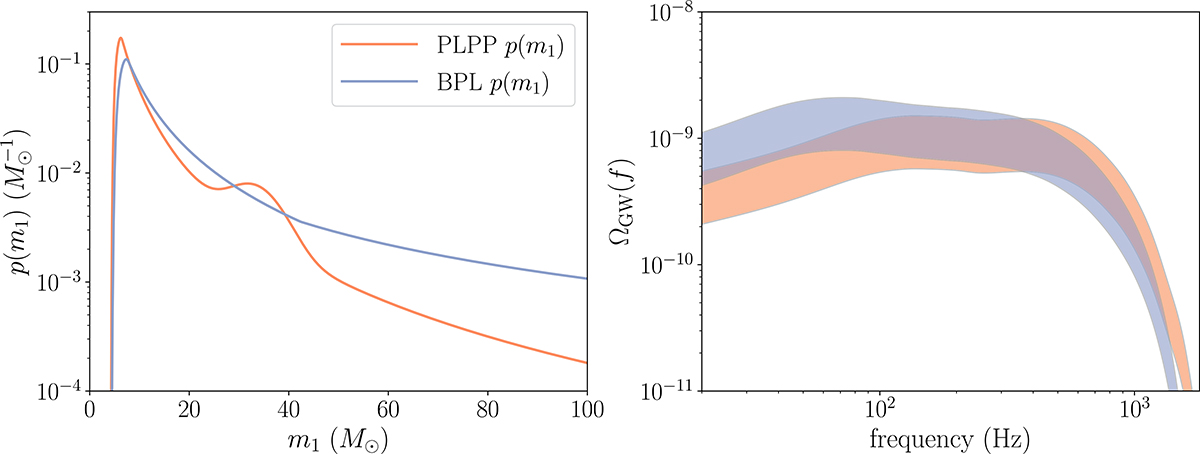
Impact of the primary mass distribution on the ΩGW spectrum. The left panel shows the two primary mass model probability densities used throughout. The right panel shows the 95% confidence intervals for ΩGW using the two mass models, including uncertainty on the local merger rate from Abbott et al. (2023a).
Current usage metrics show cumulative count of Article Views (full-text article views including HTML views, PDF and ePub downloads, according to the available data) and Abstracts Views on Vision4Press platform.
Data correspond to usage on the plateform after 2015. The current usage metrics is available 48-96 hours after online publication and is updated daily on week days.
Initial download of the metrics may take a while.