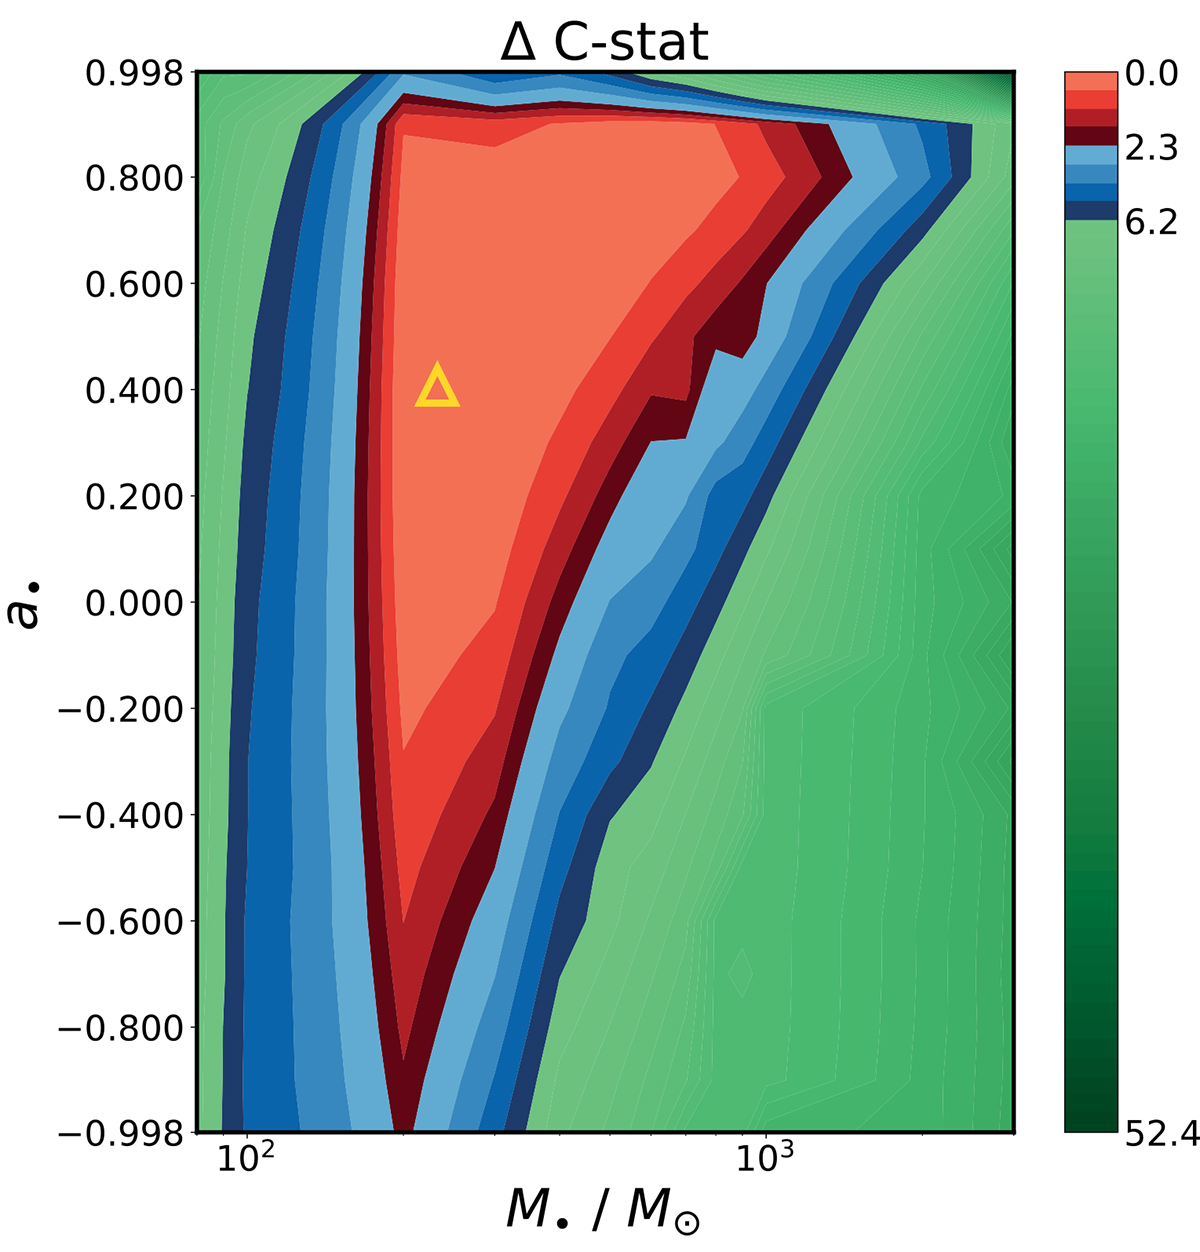
Fig. 4.
Download original image
Constraints on M• and a• based on a joint fit of the X-ray spectra from Epochs 2 to 6 with the slim-disk model (Table B.4). We calculate the ΔC-stat across the {M•, a•} plane. The best–fit point with the lowest C-stat is marked by the yellow triangle. Areas within 1σ and 2σ confidence levels are in red and blue, respectively. At 1σ for the two–parameter fits, M• is constrained to be log(![]() , while a• is virtually unconstrained.
, while a• is virtually unconstrained.
Current usage metrics show cumulative count of Article Views (full-text article views including HTML views, PDF and ePub downloads, according to the available data) and Abstracts Views on Vision4Press platform.
Data correspond to usage on the plateform after 2015. The current usage metrics is available 48-96 hours after online publication and is updated daily on week days.
Initial download of the metrics may take a while.