Fig. 1.
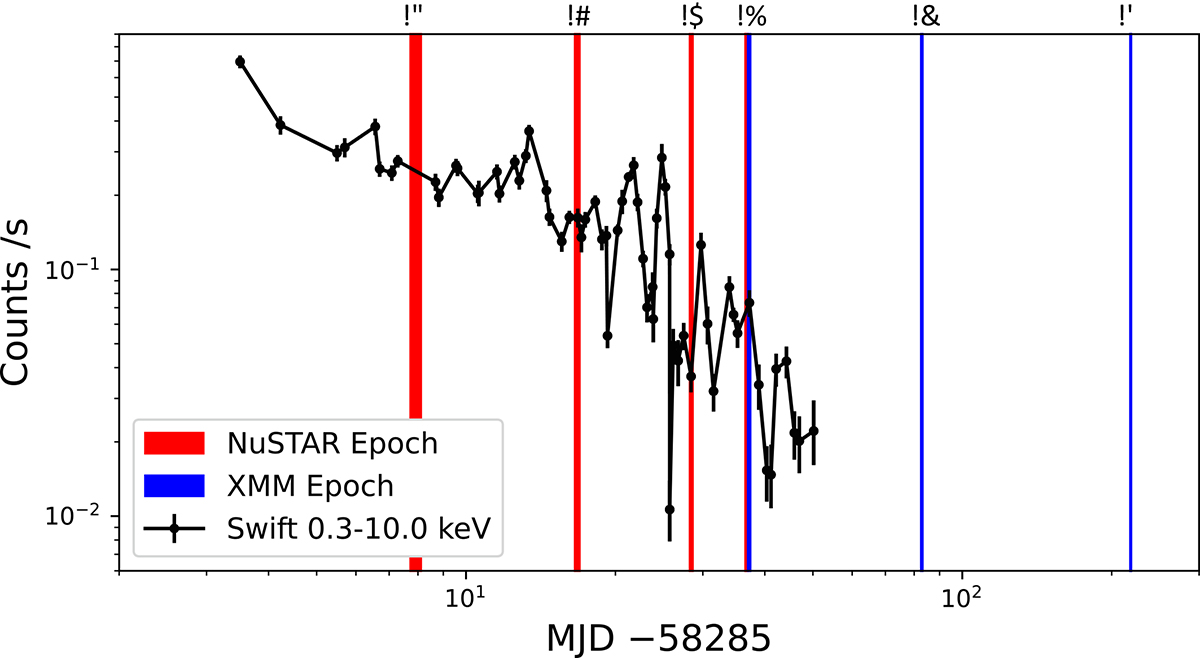
Download original image
Swift 0.3−10.0 keV light curve of AT2018cow. The times of the NuSTAR and XMM-Newton observations are highlighted with red and blue vertical lines, respectively. The six epochs we use to group the observations and the joint analysis in this paper are marked at the top of the figure. See Table B.1 for details of the observations in each epoch. We note that, at E4, the NuSTAR and XMM-Newton observations do not overlap in time.
Current usage metrics show cumulative count of Article Views (full-text article views including HTML views, PDF and ePub downloads, according to the available data) and Abstracts Views on Vision4Press platform.
Data correspond to usage on the plateform after 2015. The current usage metrics is available 48-96 hours after online publication and is updated daily on week days.
Initial download of the metrics may take a while.