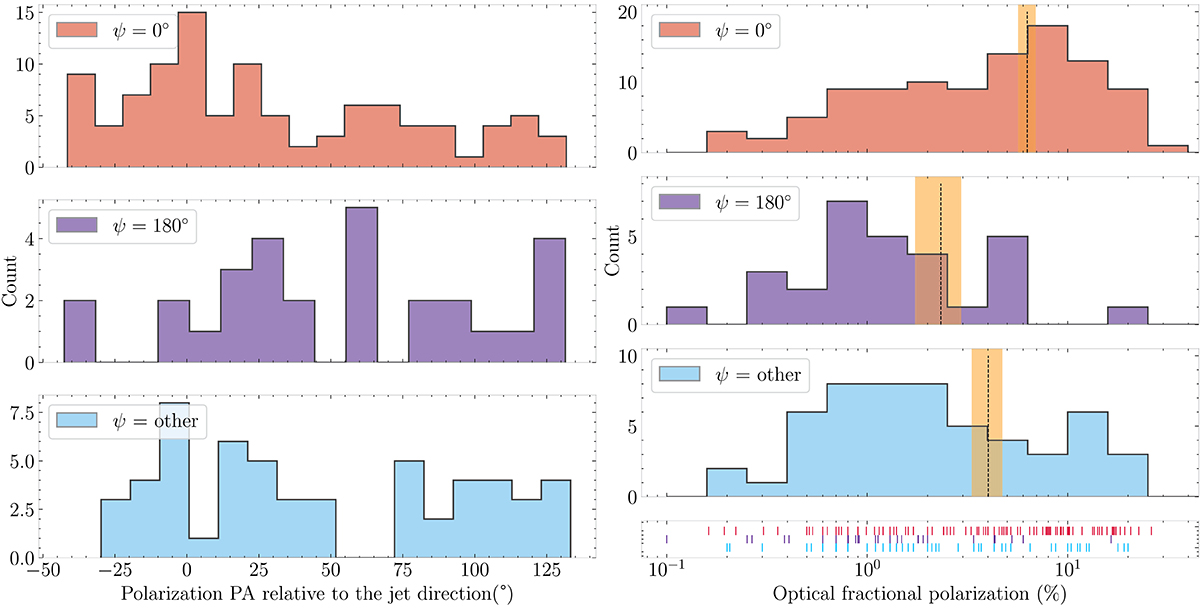
Fig. 2.
Download original image
Distribution of difference between position angles of optical polarization plane and jet direction (left column) and fractional polarization (right column) for sources of three different classes according to their VGD vector direction. The optical polarimetric data used in this plot include our polarimetric data joined with the data used by Kovalev et al. (2020). The vertical lines and orange regions indicate the sample mean and standard error. We note the logarithmic scale of the fractional polarization axis.
Current usage metrics show cumulative count of Article Views (full-text article views including HTML views, PDF and ePub downloads, according to the available data) and Abstracts Views on Vision4Press platform.
Data correspond to usage on the plateform after 2015. The current usage metrics is available 48-96 hours after online publication and is updated daily on week days.
Initial download of the metrics may take a while.