Fig. 9.
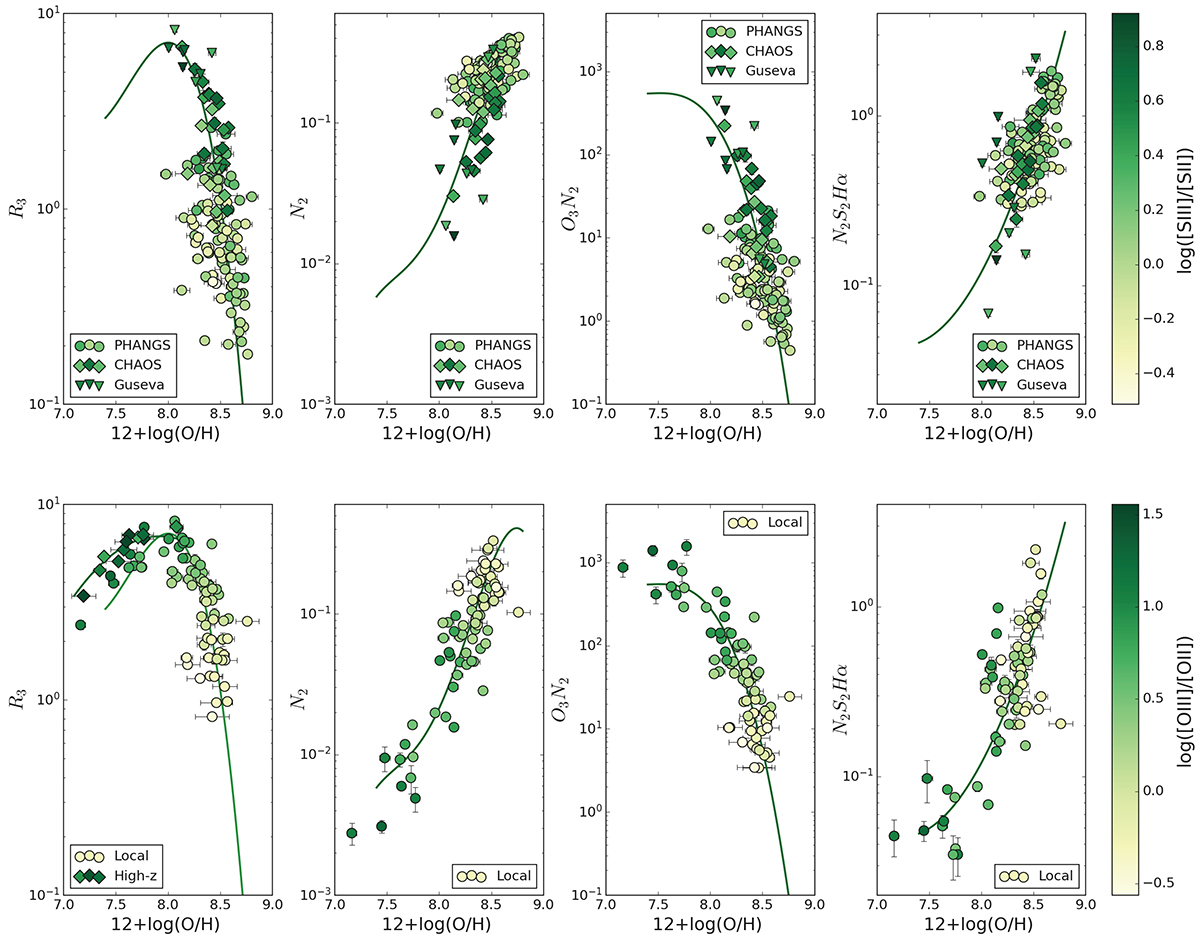
Download original image
Dependence of strong-line diagnostics on the ionization parameter. Upper panels: Strong-line diagnostics colour-coded according to the [S III]λλ9069, 9531/[S II]λλ6717, 6731 line ratio. Lower panels: Strong-line diagnostics colour-coded according to the [O III]λ5007/[O II]λλ3726, 3729 line ratio. We have labelled as ‘local’ the data from CHAOS, Curti’s, Guseva’s and Nakajima’s catalogues and as ‘high-z’ data from Sanders et al. (2023) and Laseter et al. (2024). The plotted curves are our diagnostic calibrations plus the high-redshift calibration from Sanders et al. (2023) for R3.
Current usage metrics show cumulative count of Article Views (full-text article views including HTML views, PDF and ePub downloads, according to the available data) and Abstracts Views on Vision4Press platform.
Data correspond to usage on the plateform after 2015. The current usage metrics is available 48-96 hours after online publication and is updated daily on week days.
Initial download of the metrics may take a while.