Fig. 2.
Download original image
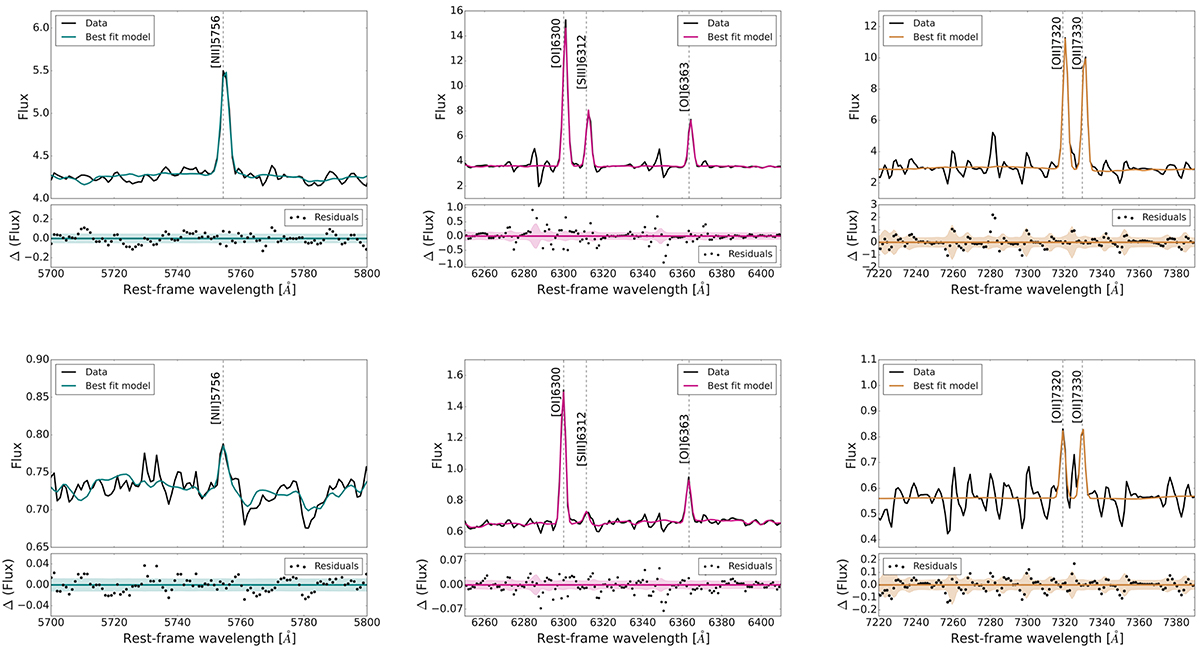
Example fits (both stellar continuum and emission lines) of spectral regions around auroral lines for two H II regions in NGC 5068 (IDs: 268 in the upper panels, the same as Fig. 1, and 817 in the lower panels). The [NII]λ5756, [SIII]λ6312 and [OII]λλ7320, 7330 auroral lines are detected with corresponding S/N of 29, 39, 22, and 20 for region 268 and 6, 7, 7, and 7 for region 817. The flux in the y axis is expressed in the same units as Fig. 1. In the lower panels, we additionally report as a shaded region the spectral error band, already re-scaled by the residuals’ standard deviation.
Current usage metrics show cumulative count of Article Views (full-text article views including HTML views, PDF and ePub downloads, according to the available data) and Abstracts Views on Vision4Press platform.
Data correspond to usage on the plateform after 2015. The current usage metrics is available 48-96 hours after online publication and is updated daily on week days.
Initial download of the metrics may take a while.