Fig. A.4.
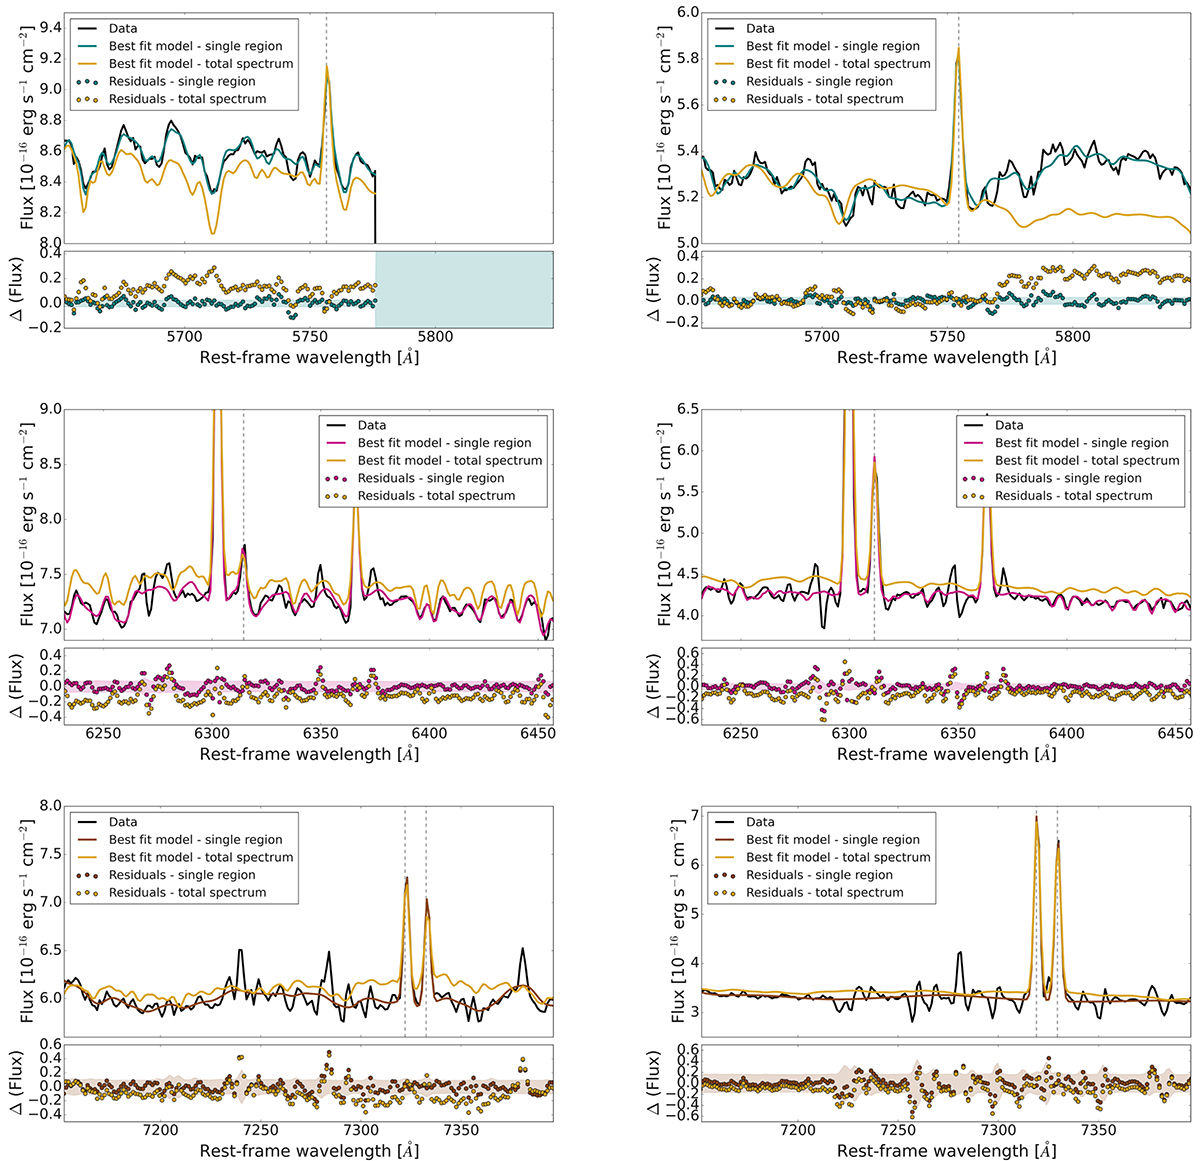
Download original image
Two representative examples of H II region spectral fitting around auroral lines where our single-region procedure leads to significantly better results than the standard total spectrum fitting. Left column: region 498 in NGC1566. The RMS of residuals around the [NII]λ5756, [SIII]λ6312 and [OII]λλ7320, 7330 auroral lines (from to bottom) is respectively of 283, 719 and 998 when considering single-region fitting, but reaches values of 1462, 1597 and 1611 when considering total spectrum fitting. For this and the other galaxies observed in AO-WFM, we exclude from RMS evaluation around [NII]λ5756 the wavelength region with λobs ≳ 5775Å, where the flux is masked because of sodium absorption. Right column: region 513 in galaxy NGC5068. In this case, the RMS of residuals around the [NII]λ5756, [SIII]λ6312 and [OII]λλ7320, 7330 auroral lines is respectively of 329, 241, and 1581 when considering single-region fitting, but reaches values of 1489, 1799, and 1933 when considering total spectrum fitting. The corrected spectral error is represented as a shaded region in the residuals panels.
Current usage metrics show cumulative count of Article Views (full-text article views including HTML views, PDF and ePub downloads, according to the available data) and Abstracts Views on Vision4Press platform.
Data correspond to usage on the plateform after 2015. The current usage metrics is available 48-96 hours after online publication and is updated daily on week days.
Initial download of the metrics may take a while.