Open Access
Fig. 2.
Download original image
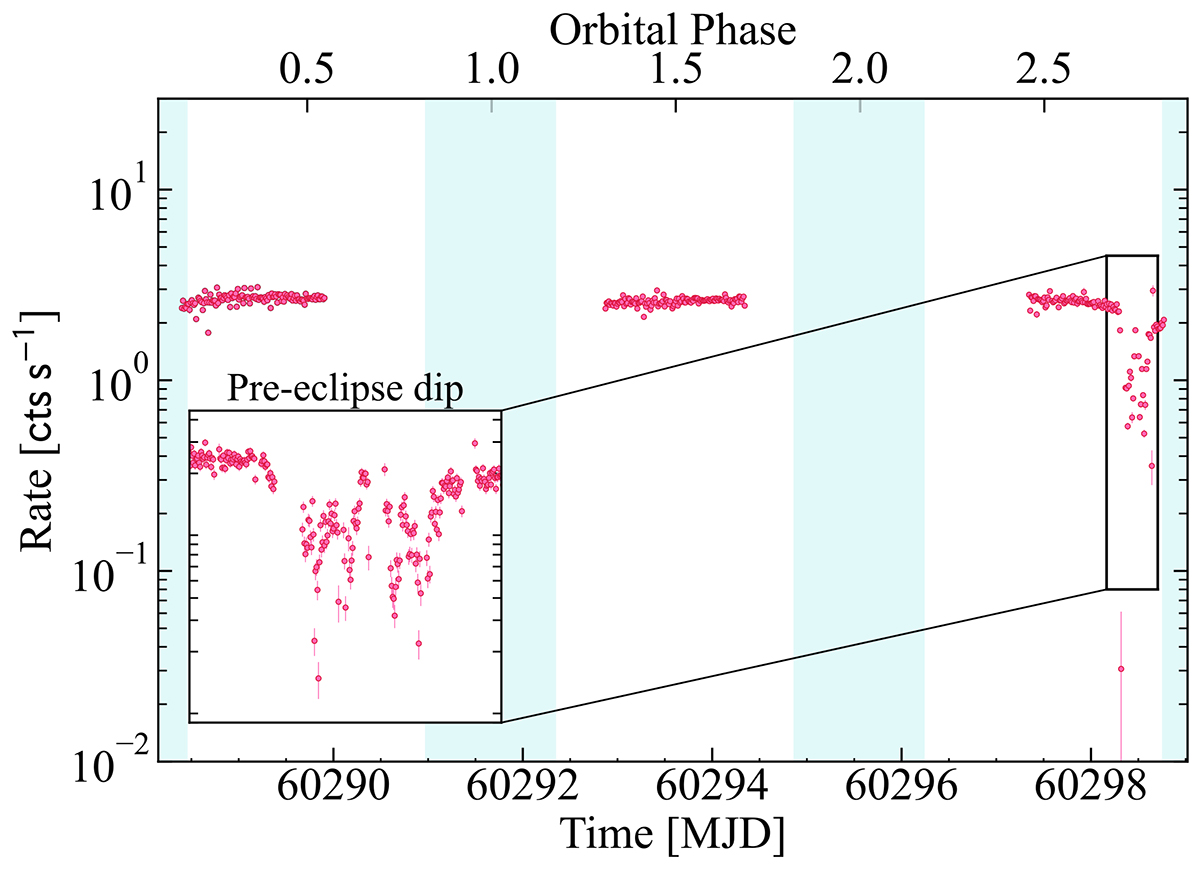
Light curve of SMC X-1 observed with IXPE in the 2–8 keV energy band. Times of eclipses are shown in the blue shaded regions. The inset displays a higher time-resolution light curve of the pre-eclipse dip detected during the third observation.
Current usage metrics show cumulative count of Article Views (full-text article views including HTML views, PDF and ePub downloads, according to the available data) and Abstracts Views on Vision4Press platform.
Data correspond to usage on the plateform after 2015. The current usage metrics is available 48-96 hours after online publication and is updated daily on week days.
Initial download of the metrics may take a while.