Open Access
Fig. 1.
Download original image
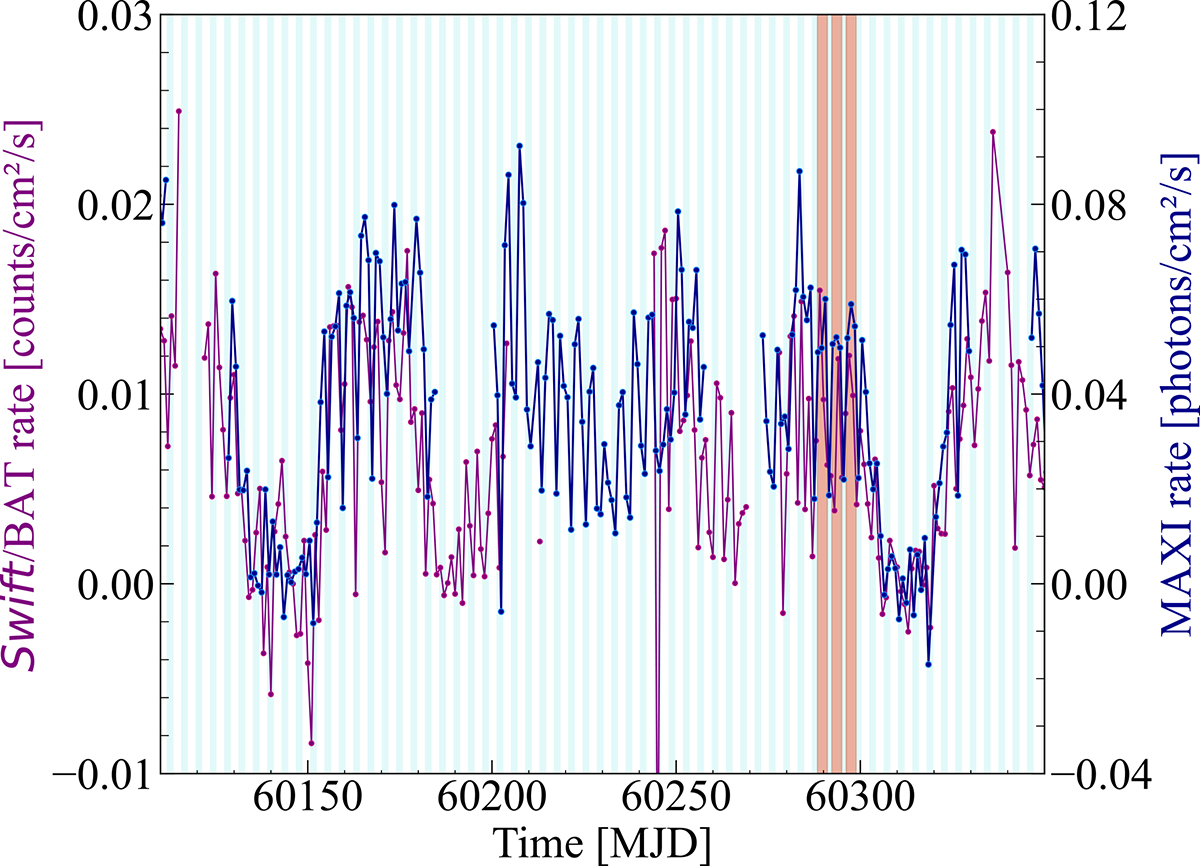
Swift/BAT (15–50 keV) and MAXI (4–10 keV) one-day averaged light curves of SMC X-1 in purple and blue, respectively. Vertical light blue lines show the eclipses and vertical pink lines display the times of the observations with IXPE. Error bars have been removed for visual clarity.
Current usage metrics show cumulative count of Article Views (full-text article views including HTML views, PDF and ePub downloads, according to the available data) and Abstracts Views on Vision4Press platform.
Data correspond to usage on the plateform after 2015. The current usage metrics is available 48-96 hours after online publication and is updated daily on week days.
Initial download of the metrics may take a while.