Fig. 5
Download original image
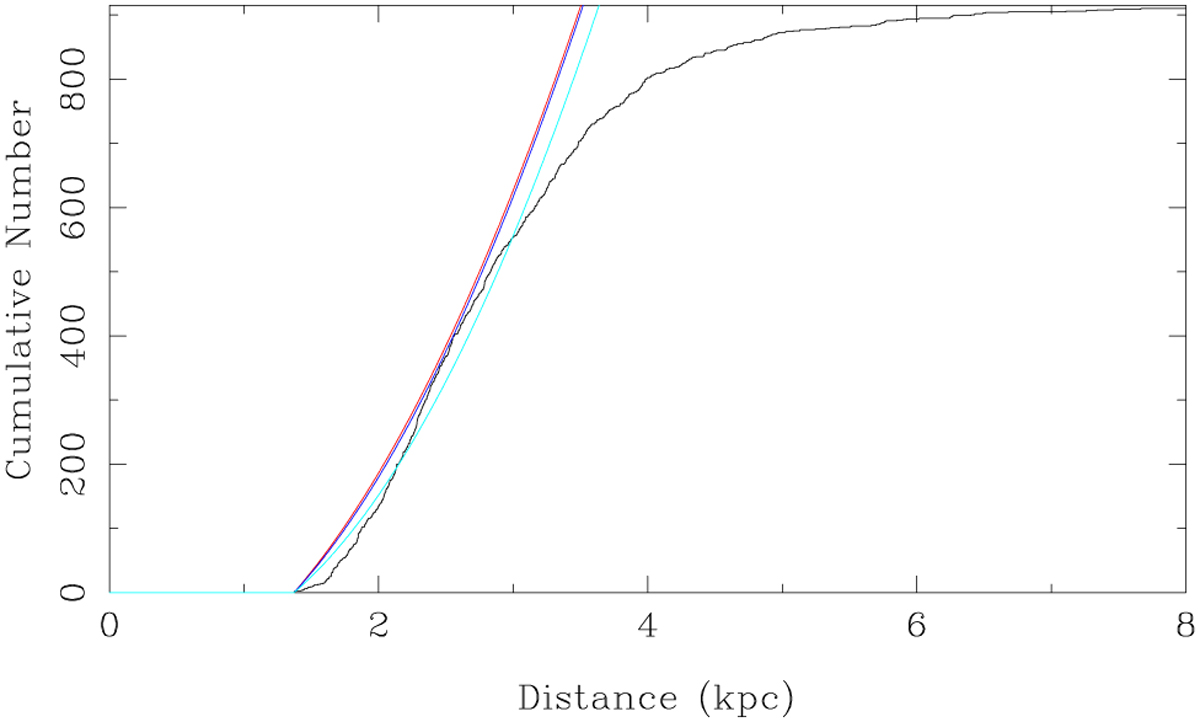
Cumulative number of stars in the selection box. Coloured lines indicate model predictions (Groenewegen et al. 1992, Eq. (20)) for a volume density (ρ0) of 70 /kpc3 and scale height H = 200 pc (red), ρ0 = 28/kpc3 and H = 500 pc (dark blue), and ρ0 = 14/kpc3 and H = 1000 pc (light blue). The expected number of stars inside approximately 1.4 kpc is subtracted (158, 132, and 95 stars, respectively).
Current usage metrics show cumulative count of Article Views (full-text article views including HTML views, PDF and ePub downloads, according to the available data) and Abstracts Views on Vision4Press platform.
Data correspond to usage on the plateform after 2015. The current usage metrics is available 48-96 hours after online publication and is updated daily on week days.
Initial download of the metrics may take a while.