| Issue |
A&A
Volume 691, November 2024
|
|
|---|---|---|
| Article Number | A268 | |
| Number of page(s) | 8 | |
| Section | Astrophysical processes | |
| DOI | https://doi.org/10.1051/0004-6361/202450657 | |
| Published online | 19 November 2024 | |
NICER and Swift/XRT monitoring of the 2023 outburst of Swift J1727.7–1613
1
Jülich Supercomputing Centre, Forschungszentrum Jülich, Wilhelm-Johnen-Straße, 52428 Jülich, Germany
2
Institute of Astronomy, National Tsing Hua University, No. 101 Sect. 2 Kuang-Fu Road, 30013 Hsinchu, Taiwan
⋆ Corresponding authors; This email address is being protected from spambots. You need JavaScript enabled to view it.
; This email address is being protected from spambots. You need JavaScript enabled to view it.
Received:
8
May
2024
Accepted:
30
September
2024
Abstract
Aims. The X-ray transient Swift J1727.7–1613 was first detected on August 24 2023 by Swift/BAT and INTEGRAL. We investigated data from the Neutron star Interior Composition Explorer (NICER) and the Neil GehrelsSwift Observatory taken between August and October 2023.
Methods. We studied diagnostic diagrams, energy spectra, and short term variability. The observations cover the initial rise of the outburst in the hard state and the transition to the soft state. We focused on the evolution of quasi-periodic oscillations (QPOs) using power-density spectra and on the evolution of the spectral parameters.
Results. The overall evolution of Swift J1727.7–1613 is consistent with this source being a low-mass black hole X-ray binary. Based on the Lense-Thirring precession interpretation of type-C QPOs, we obtained outer radii for the hot inner flow and found that the overall evolution of these radii agrees well with the evolution of the inner disc radii obtained from fits to the energy spectra. This result holds on all timescales tested in this study and supports the Lense-Thirring precession interpretation of type-C QPOs.
Key words: accretion, accretion disks / black hole physics / binaries: general / X-rays: individuals: Swift J1727.7–1613
© ESO 2018
 Open Access article, published by EDP Sciences, under the terms of the Creative Commons Attribution License (http://creativecommons.org/licenses/by/4.0), which permits unrestricted use, distribution, and reproduction in any medium, provided the original work is properly cited.
1. Introduction
Most low-mass black hole X-ray binaries (LMXBs) belong to the class of transient sources. During their outbursts, which typically last from weeks to months, the majority of them evolve through different states (McClintock & Remillard 2006; Belloni 2010). The outburst evolution can be studied by making use of a hardness intensity diagram (HID; Homan et al. 2001; Belloni et al. 2005; Homan & Belloni 2005; Gierliński & Newton 2006; McClintock & Remillard 2006; Fender et al. 2009; Belloni 2010; Belloni et al. 2011), a hardness root-mean square (rms) diagram (HRD; Belloni et al. 2005), and an rms intensity diagram (RID; Muñoz-Darias et al. 2011). Outbursts begin and end in the low-hard state (LHS) and during many outbursts a transition to the high-soft state (HSS) can be observed. During this transition, two further states, the hard and soft intermediate states (HIMS and SIMS), can be observed. The LHS shows an rms of several tens of percent and the emission is dominated by thermal Comptonisation in a hot, geometrically thick, optically thin plasma located in the vicinity of the black hole, where softer seed photons coming from an accretion disc are up-Comptonised (see Done et al. 2007; Gilfanov 2010, for reviews). In the intermediate states, the mass accretion rate increases. The stronger contribution of emission from the accretion disc leads to a softer hardness ratio (HR) and that is why the intermediate states are located to the left of the LHS in the HID. Regarding their timing properties, in the HIMS the band-limited noise (BLN) shows a reduced strength, while in the SIMS the BLN is replaced by a power-law noise (Belloni et al. 2011). The HSS has an even lower variablility (fractional rms ∼1 percent, e.g. Belloni et al. 2005) and the energy spectrum is clearly dominated by an optically thick, geometrically thin accretion disc (Shakura & Sunyaev 1973).
The different states and transitions between them are attributed to major changes in the properties of the inner accretion flow (e.g. Done et al. 2007) and they can be explained by a geometrically thin, optically thick accretion disc with an inner truncation radius varying as a function of the accretion rate (e.g. Esin et al. 1997, 2001). Observations show that during the HSS the accretion disc extends down to the innermost stable circular orbit (ISCO; see e.g. Gierliński & Done 2004; Steiner et al. 2010; Nakahira et al. 2012; McClintock et al. 2014; Nampalliwar & Bambi 2018; De Rosa et al. 2019; Fabian et al. 2020). For the LHS, the situation is much less clear, as different observational studies give different estimates of how close the disc comes to the black hole in this state (e.g. Miller et al. 2006; Petrucci et al. 2014; Done & Diaz Trigo 2010; Kolehmainen et al. 2014; Plant et al. 2015). In the truncated disc model, it is assumed that the disc recedes in the LHS and that the inner parts are filled by a radiatively inefficient, optically thin, advection-dominated accretion flow (e.g. Narayan & Yi 1995; Esin et al. 1997).
The different states also show different features in power density spectra (PDS; Belloni & Stella 2014, and references therein). The PDS of many outbursts show type-C quasi-periodic oscillations (QPOs) (Wijnands & van der Klis 1999; Motta et al. 2011, and references therein) in the LHS and HIMS (McClintock & Remillard 2006; Belloni 2010). These PDS can be well fitted with a combination of Lorentzian components (van der Klis 1994a, 1994b; Nowak 2000; Belloni et al. 2002, 2005; Stiele & Kong 2018, 2020, 2021). The QPOs are fitted with a Lorentzian from which the centroid frequency (ν0) and half width at half maximum (Δ) of these oscillations can be obtained. The centroid frequencies of type-C QPOs range from 0.01 to 30 Hz, and their quality factor (Q = ν0/(2Δ)) is ≳10 (see e.g. Casella et al. 2005; Rao et al. 2010). Often one or two overtones and at times a sub-harmonic can be observed, which are fitted with additional Lorentzians. The PDS always show BLN (fitted with one or more zero-centred Lorentzians) and the characteristic frequency of the QPO is anti-correlated with the total broadband fractional rms variability. Lense-Thirring precession of a radially extended region of the hot inner flow can explain the cause of these oscillations (Stella & Vietri 1998; Ingram et al. 2009). The SIMS is defined by the presence of another type of QPO, the type-B QPO. Its centroid frequency, which lies between 0.8–6.4 Hz, is correlated with the hard X-ray flux (see Motta et al. 2011). The Q factor is bigger than six and often an overtone and a sub-harmonic can be seen. In this state, the PDS shows a power-law noise instead of the BLN seen in the harder states. In softer states, a third type of QPO can be found. These type-A QPOs are broad (Q ∼ 1 − 3) and weak (fractional rms < 5%) and have centroid frequencies of 6.5–8 Hz (Casella et al. 2005; Motta et al. 2011).
Swift J1727.7–1613 was first detected by both Swift/BAT and INTEGRAL on August 24 2023 (Page et al. 2023). The outburst of this new transient was followed by many optical (Wang & Bellm 2023; Baglio et al. 2023) and X-ray telescopes (Negoro et al. 2023; O’Connor et al. 2023; Liu et al. 2023; Sunyaev et al. 2023; Dovciak et al. 2023). The detection of bright emission lines of hydrogen and helium in optical spectra led to the classification of Swift J1727.7–1613 as an LMXB candidate (Castro-Tirado et al. 2023). Energy spectra and temporal properties observed in the X-rays further support this classification (Palmer & Parsotan 2023; Draghis et al. 2023). A study of spectral and timing properties observed during the initial outburst phase at high energies with INTEGRAL and SRG/ART-XC has been presented by Mereminskiy et al. (2024). Further studies focus on investigating the X-ray polarisation during state transition (Ingram et al. 2024) and optical spectra (Mata Sánchez et al. 2024). In this paper, we present a comprehensive study of the temporal variability properties of Swift J1727.7–1613 observed during its 2023 outburst based on NICER and Swift/XRT data. We also include a study of the spectral properties based on NICER data.
2. Observation and data analysis
2.1. NICER
The Neutron star Interior Composition Explorer (NICER; Gendreau et al. 2012) observed Swift J1727.7–1613 between August 25 and October 9 2023. We used HEAsoft (v. 6.32) tasks to derive PDS from the pre-processed event files provided by the NICER datacenter. To study the low-frequency QPOs, which can appear at frequencies between ∼0.01 Hz and 30 Hz (see Sect. 1), we used time bins of 0.01 s and intervals of 16 384 bins, and thus covered frequencies between 6.1 × 10⁻³ and 50 Hz. Giving the brightness of the source contribution from background photons to the PDS can be neglected. We then normalised the PDS that cover the full energy range according to Leahy et al. (1983) and subtracted the contribution due to Poissonian noise, which has an expected value of 2 (see Sect. 2.2 for a way to take instrumental effects that can cause (slight) deviations from this value into account). The PDS were then converted to square fractional rms by dividing them by the square of the intensity, which leads to the intrinsic power being independent of the rate (van der Klis 1989; Belloni & Hasinger 1990).1 We fitted the PDS with Lorentzians, some centred at zero and others not. The zero-centred Lorentzians were identified as BLN, while the non-zero-centred ones represented the QPOs. In 13 NICER observations (between September 16 and 24), (almost) no exposure is left after screening, and hence we cannot include these observations in our study.
We also studied energy spectra. They were extracted together with background and response files using the task nicerl3-spect. We extracted a background file based on the SCORPEON model that can be fitted to the spectrum. The spectral fitting was done with XSPEC (V. 12.13.1; Arnaud 1996).
2.2. Neil GehrelsSwift Observatory
We also analysed all Swift/XRT (Burrows et al. 2005) monitoring data of Swift J1727.7–1613 obtained in window timing mode between August 28 and October 24 2023. To extract energy spectra of each observation, we made use of the online data analysis tools provided by the Leicester Swift data centre2, including single-pixel events only (Evans et al. 2009). We used the GHATS package (v. 1.1.1) developed at INAF-OAB3 to obtain PDS in the 0.3–10 keV energy band, following the procedure outlined in Belloni et al. (2006). The PDS, covering frequencies between 4 × 10⁻³ Hz and 35.13 Hz, were not corrected for any contribution due to background photons. To subtract the contribution due to Poissonian noise (Zhang et al. 1995), we fitted the flat tail of the Leahy-normalised PDS at the high-frequency end (above ∼30 Hz) with a constant (see e.g. Stiele & Kong 2020, 2021). The value of this constant gives the level of the Poissonian noise. This approach allowed us to take into account deviations from the expected value of 2, which are caused by pile-up effects in the Swift/XRT data (Kalamkar et al. 2013). We then converted them to square fractional rms.
3. Results
3.1. Diagnostic diagrams
We derived source count rates from the Swift/XRT data in three energy bands, making use of the online data analysis tools (see Sect. 2.2): total (0.3–10 keV), soft (0.3–3 keV), and hard (3–10 keV). We also determined NICER count rates from the energy spectra with XSPEC using the total (0.5–10 keV), soft (0.5–2 keV), medium (2–4 keV), and hard (4–10 keV) bands. The Swift/XRT and NICER light curves are shown in Fig. 1. The HRs were obtained for Swift/XRT by dividing the count rate observed in the hard band by the one obtained in the soft band. To get HRs for NICER data, we divided the count rate in the hard band by the one of the medium band. For Swift/XRT, the fractional rms was determined in the 0.3 – 10 keV band and in the 4 × 10⁻³ – 35.13 Hz frequency range, while for NICER we used the total energy band and the 6.1 × 10⁻³ – 50 Hz frequency range.
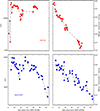 |
Fig. 1. Light curve of the 2023 outburst of Swift J1727.7–1613 based on Swift/XRT and NICER data. Each data point represents one observation. T=0 corresponds to August 24 2023 00:00:00.000 UTC. |
The NICER light curve shows the initial outburst rise, which is followed by a plateau where the count rate stays rather constant (around about 22,300 cts/s) for about 10 days. After a gap of about three days, Swift J1727.7–1613 is observed at a lower count rate. After another gap of about 16 days, due to observations with (almost) zero exposure after filtering, the source is observed again at a count rate similar to the one during the plateau phase (21 600 cts/s). The Swift/XRT light curve covers the finial phase of the initial rise before Swift J1727.7–1613 enters into the plateau phase. The lower count rates around day 20 and the return to count rates similar to the one seen during the plateau phase around day 40 can also been observed in the Swift/XRT light curve. Furthermore, it shows that the source made an excursion towards higher count rates around day 30. While the coverage of the outburst with Swift/XRT data is less dense, it could follow the outburst for a further 17 days, showing that overall after the initial rise the count rate fluctuates around a plateau for about 38 days before the count rates decreases.
The HID (Fig. 2) based on NICER data shows that overall the source softens during the outburst, with a few excursions towards higher HRs. The overall trend towards a softening of the HR is also visible in the HID based on Swift/XRT data; however, it is less obvious as due to the inclusion of softer photons the excursions towards harder HRs are more numerous and more pronounced. Including further NICER observations up until May 7 2024 in the HID (shown as grey points is Fig. 2, and otherwise not used in our study), we find that the HID shows the q-shape typically seen in black hole X-ray binaries. The observations investigated in our study cover the initial rise and the upper branch, corresponding to the transition from the hard state to the soft one.
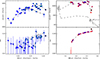 |
Fig. 2. Hardness intensity diagram (upper panel) and hardness rms diagram (lower panel), derived using Swift/XRT (left panels) and NICER (right panels) data. Each data point represents one observation. In the HID based on NICER data, we include further observations (grey points) to show that the overall evolution of the source shows the q-shape typically seen in HIDs of black hole LMXBs. The first observation is marked with a (black) star. Observations in which type-C QPOs are detected are marked by down-pointing triangles, while observations in which type-B QPOs are detected are marked by up-pointing triangles. The triangles are filled when the feature is detected with ≥3σ. |
From the HRD (Fig. 2) obtained from NICER data, we see that until day 23 the fractional rms shows a slow decrease with values around 10 percent. After day 39, the rms drops to values below 2 percent. The overall trend in the evolution of the fractional rms seen in the HRD based on NICER data also shows up in the HRD based on Swift/XRT observations. However, the HRD based on Swift/XRT data is less conclusive, as the rms values obtained from Swift/XRT have bigger uncertainties.
The RID (Fig. 3) based on NICER data shows that at the beginning of the outburst (until day 6) Swift J1727.7–1613 follows a ‘hard line’, a linear relation between the total rms and the count rate, seen during the outburst rise of black hole X-ray binaries (Muñoz-Darias et al. 2011). During the outburst evolution when the source transits through the different states, the total and fractional rms decrease.
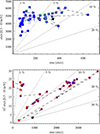 |
Fig. 3. Total rms intensity diagram, derived using Swift/XRT (upper panel) and NICER (lower panel) data. Each data point represents one observation. The symbols are the same as in Fig. 2. |
3.2. Timing properties
3.2.1. NICER
In the NICER observation taken on day 2, the PDS shows a BLN component and a QPO with a characteristic frequency of 0.37 Hz and a Q factor of 7.9 but at a low significance of 2.0σ. The PDS of the NICER observations taken between day 4 and until day 42 can be well described by two BLN components and two QPOs. In the NICER observations taken on days 12, 19, 20, and 23, the fundamental QPO appears as a double-peak feature with a separation in the characteristic frequencies of the two peaks of less than 1 Hz. We split these observations into snapshots (see Stiele & Kong 2023) and studied the PDS of the individual snapshots. Within the PDS of the individual snapshots, we always find a well defined single-peak QPO. This shows that the characteristic frequency of the QPO can change by up to several tenths of a hertz on timescales of a few hours.
The evolution of the characteristic frequency of the QPOs is shown in Fig. 4. The characteristic frequency of the fundamental QPO increases from ∼0.4 Hz on day 2 to a plateau at about 1.3 Hz between days 6 and 16. During this time, the characteristic frequency of the fundamental QPO fluctuates between 1.0 and 1.6 Hz. Between days 19 and 23, the characteristic frequency varies around an average value of 2.6 Hz (2.0–3.3 Hz). Between days 39 and 42, values between 6.4 and 9.3 Hz are observed. The Q factor ranges between 4 and 13 and the significance of detection is always above 3σ, apart from the observations on days 2.52, 41.12, and 42.22 (see Table 1; available on Zenodo). The second QPO has a characteristic frequency that increases from ∼2 Hz on day 4 to a plateau at ∼3.3 Hz between days 6 and 16. In observations taken between days 19 and 23, it varies between 4.4 and 6.5 Hz. The observed Q factors are lower with values between 0.5 and 7.1 for the observation taken until day 23. Apart from the observation on day 4, this feature is also detected with a significance of > 3σ in these observations. After day 39, a second QPO is detected at low significance (< 1.7σ) and the characteristic frequency varies between 2.9 and 15.1 Hz (Table 2; available on Zenodo).
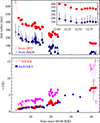 |
Fig. 4. Evolution of QPO frequencies (lower panel) and of outer hot flow and inner disc radii, respectively (upper panel). Lower panel: Evolution of the characteristic frequency of the QPOs during the outburst. Circles indicate fundamental QPOs from NICER observations, while down-pointing triangles indicate upper harmonics. Fundamental QPOs from Swift/XRT observations are indicated by squares. Upper panel: Comparison of the radius derived from the characteristic frequency of the fundamental QPO following Ingram et al. (2009) and from the normalisation of the diskbb model (Mitsuda et al. 1984) fitted to the energy spectra obtained from NICER observations. The inset exemplifies the evolution within one day. In both panels, filled symbols indicate observations or snapshots in which the QPO is observed at ≥3σ. |
The correlation between the broadband fractional rms and the characteristic frequency is shown in Fig. 5. The observed anti-correlation between rms and frequency suggests that the oscillations up until day 23 are type-C QPOs. For the oscillations observed between days 39 and 42 with characteristic frequencies between 5 and 7 Hz, the total rms is about 2 percent. The values of the characteristic frequency and the flat distribution hint at these oscillations being type-B QPOs. In the observations taken after day 42, no QPOs are detected.
One model to explain type-C QPOs is the Lense-Thirring precession of a hot inner flow in a truncated accretion disc. Taking the equations and parameter values (ζ = 0; h/r = 0.2) given in Ingram et al. (2009), we can transfer the characteristic frequency of the fundamental QPO to the outer radius of the hot inner flow. We obtain values between 44Rg and 6Rg. The evolution of the radii is shown in the upper panel of Fig. 4 (red circles). During the plateau between days 6 and 16, the radius derived from the QPO frequency fluctuates around 23Rg. Superimposed are the variations, on a timescale of hours, in the QPO frequency, and hence the radius, which are shown as an example for day 12 in the inset of Fig. 4.
As there is an overall anti-correlation between the frequency and the radius, changes at lower frequencies imply larger changes in the radius. Depending on the spin parameter and the mass of the black hole, the change in characteristic frequency from 1.09 to 1.34 Hz within 3.08 hours (on day 12) corresponds to a change in the radius of up to 2.66Rg or 12 717 m h−1 (for a = 0.9 and MBH = 10M⊙). The average velocity derived from the change of the characteristic frequency from 1.14 to 1.41 Hz within the 10 days of the plateau is 165 m h−1. If the type-C QPOs are related to the radius of the hot inner flow, there must be a mechanism that causes rather fast changes in the radius on a timescale of hours, while the overall evolution of the radius over several days progresses much more slowly.
An alternative explanation for type-C QPOs is a model based on the concept of radiative feedback between hot electrons in the corona and soft radiation from the accretion disc (Mastichiadis et al. 2022). The electron population is heated by some unspecified mechanism that injects a fraction, f ≤ 1, of the energy being released when mass is accreted from infinity to the radius of the innermost stable orbit. In this model of Mastichiadis et al. (2022), the corona is modelled as a sphere of radius rc, while the soft radiation is assumed to be produced within a sphere of radius rd. This radiation is a result of the reprocessing of hard coronal radiation. Furthermore, damped oscillations, which are identified with type-C QPOs, have been observed. As a result of the damping, the oscillations must be sustained by small fluctuations in the accretion rate. To quench the type-C QPOs, the electrons must rapidly depart from the corona. This occurs as the corona contracts and the outflow narrows progressively as the source transitions from the hard state to the soft one. According to Eq. (15) in Mastichiadis et al. (2022), which was obtained from a stability analysis of the energy balance of the electrons and the hard photon energy density, the natural frequency of the system is f0 ∝ rc−3/2, where rc is the radius of the corona. Using the values given in Mastichiadis et al. (2022), we find that the fast change in the characteristic frequency on a timescale of hours corresponds to a change in the radius of 87 253 m h−1, while the average change within the 10 days relates to 1 119 m h−1. So, again, the model requires a mechanism to explain the highly variable frequency and radius on a timescale of hours, while these quantities evolve more steadily over several days.
3.2.2. Swift
The PDS of the Swift/XRT observations taken between day 4 and 24 can be well described by up to two BLN components and a QPO. In some of the observations, an upper harmonic can be detected. The characteristic frequency of the fundamental QPO increases from 0.77 Hz on day 4 to ∼2.8 Hz on day 24, also showing a plateau between days 6 and 16, although it is less pronounced than in the NICER data as there are fewer Swift/XRT observations (Fig. 4). In most of the observations, the Q factor is between ∼7 − 10 and apart from two observations the significance is > 3σ. The upper harmonics are observed at characteristic frequencies between ∼1.8 and ∼4 Hz, with Q factors between 1.7 and 8, and a significance between about 1.4 and 3σ.
The PDS of Swift/XRT observations taken between days 27 and 32 show one noise component and a QPO with characteristic frequency increasing from 4.8 and 6.6 Hz. The Q factor is > 8 and the significance is between 0.9 and 4.3σ. The correlation between the total fractional rms and the characteristic frequency is shown in Fig. 5. The QPOs up to and including day 27 are type-C QPOs, while the QPOs seen on days 30 to 32 are of type-B.
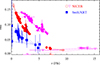 |
Fig. 5. Correlation of the broadband fractional rms variability with the characteristic QPO frequency derived from NICER and Swift/XRT data. The symbols are the same as in the lower panel of Fig. 4. |
In the PDS of the Swift/XRT observation taken on day 33, a QPO-like feature (Q = 6.08) that shows a ridge towards lower frequencies at a characteristic frequency of 94 ± 5 mHz is detected at 3.78σ. On the next day, the PDS shows BLN and a type-C QPO (Q = 18.7) with a characteristic frequency of 4.34 ± 0.05 Hz at 3.45σ. On days 35 and 39, a type-B QPO may be present in the PDS; however, the significance of detection is low (≲1.5σ). The PDS of day 60 shows two QPO-like feature at characteristic frequencies of 55 ± 4 mHz and 102 ± 5 mHz, respectively. The feature at lower frequency has a Q-factor of 3.7 and is detected at 3.3σ, while the other one has a Q-factor of 7.6 and is detected at 2.7σ.
3.3. NICER spectral properties
For the NICER observations, energy spectra in the 0.5 – 10 keV range were fitted with XSPEC (Arnaud 1996)4. For the four observations for which the characteristic frequency of the QPO varied so significantly between individual snapshots that the PDS of the entire observation displayed double-peaked QPOs (see Sect. 3.2.1), we extracted and analysed the energy spectra of individual snapshots. The spectra were grouped in an ‘optimal’ way based on Kaastra & Bleeker (2016) so that the best fit could be obtained using χ2 minimisation. Systematic uncertainties of one percent were assumed.
The spectral background is described by the SCORPEON model (v22)5 that is fitted to the energy spectrum together with the model components describing the source emission. To model the source spectrum, we used an absorbed diskbb model (Mitsuda et al. 1984) together with the Comptonisation component nthcomp (Zdziarski et al. 1996; Życki et al. 1999). The seed photon temperature of the latter component was set to the inner disc temperature. The foreground absorption was modelled with tbabs (Wilms et al. 2000), using the abundances of Wilms et al. (2000) and the cross-sections given in Verner et al. (1996). In some observations, an additional gaussian component was included to model residuals around 6.6 keV related to the iron line.
With this model, we obtained acceptable fits for all observations. Observations for which a higher reduced χ2 value was obtained show stronger residuals around the gold edge at ∼2.2 keV. For the observation that shows the strongest residuals, we repeated the fit excluding the 2.1–2.3 keV range and obtained spectral parameter values that are consistent within errors with the original ones. We therefore decided to work with the original fits (and treat all observations the same) as the outlying data points around the gold edge seem to increase only the reduced χ2 value but do not change the spectral parameter values significantly. The evolution of the spectral parameters during the outburst is shown in Fig. 6. The obtained averaged foreground absorption  cm−2 is similar to that of other Galactic X-ray binaries (Stiele & Yu 2015). As we modelled the spectra individually, some variation in this parameter (within error bars) is to be expected (Stiele & Kong 2018) and does not indicate any actual change in the foreground absorption. The temperature of the accretion disc remains rather constant at about 0.31 keV up until about day 16. Between days 19 and 23, it is more variable, with an average value of ∼0.38 keV. After day 39, it increases to values between 0.62 and 0.85 keV. From the normalisation of the diskbb model, we can derive the disc inner radius using a distance of 2.7 ± 0.3 kpc (Mata Sánchez et al. 2024). For the inclination of Swift J1727.7–161327, we used
  reported by Peng et al. (2024) and took into account a possible higher inclination of θ = 47.9 ± 0.03° (Draghis et al. 2023) when determining the error bars. The inner radius of the disc first increases from about 114 km to a maximum of about 273 km at day 2.5 and then shows a decay to a plateau around 154 km between days 6 and 16. Between days 19 and 24, the inner disc radius appears to be rather variable around an average radius of 74 km. After day 39, the radius shows another plateau at about 23 km. The obtained photon index increases from 1.6 at the beginning of the outburst to ∼2.3 on day 23. After day 39, photon indices between 3.0 and 3.9 are obtained. Trying to fit the observations taken between days 39 and 46 with only an absorbed diskbb component results in statistically unacceptable fits with strong residuals. The normalisation of the nthcomp component is rather constant with values around 41. It fluctuates more between days 19 and 23 and shows an excursion towards lower values after day 43. The electron temperature is not well constrained and for many observations only lower limits can be obtained. This has to be expected as the missing coverage of higher energies above 10 keV in NICER spectra leads to lower values of the electron temperature.
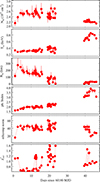 |
Fig. 6. Evolution of spectral parameters, fitting NICER spectra with an absorbed disc blackbody and Comptonisation model. Given parameters are (from top to bottom): foreground absorption, inner disc temperature, inner disc radius, photon index, nthcomp normalisation, and reduced χ2. The electron temperature is not shown as it is not well constrained. |
4. Discussion
We have investigated the Swift/XRT and NICER monitoring observations of the 2023 outburst of Swift J1727.7–1613, which was first detected by Swift/XRT and INTEGRAL on August 24 2023. It was followed up by Swift and NICER until October 2023.
The HIDs show that Swift J1727.7–1613 evolves during the part of its 2023 outburst that is covered by NICER and Swift observations from the LHS through the HIMS and SIMS into the HSS. This evolution agrees with the q-shape or turtle-head pattern observed in many black hole X-ray binary outbursts.
The RID shows that in the first six observations Swift J1727.7–1613 follows a hard line with a rather low fractional rms of around 15%. Typically, the hard line is observed at higher fractional rms values of about 30–40% (see e.g. Muñoz-Darias et al. 2011; Stiele & Kong 2020; Alabarta et al. 2020; Zhang et al. 2020; Yao et al. 2021). During later parts of its outburst, the total rms decreases, together with the fractional rms.
For observations taken between day 2 and day 42, QPOs have been detected in the NICER data. Regarding Swift/XRT PDS, QPOs are detected with a detection significance above 3σ between day 4 and day 34. The centroid frequency of the fundamental QPO and its evolution during the outburst agrees well in the PDS of the two instruments. In the NICER PDS, a harmonic at higher frequencies can be observed. During the outburst, a clear evolution of the fundamental QPO centroid frequency from ∼0.4 to ∼3.2 Hz on day 23 can be observed. The frequency range in which the QPOs are observed, the Q factors, and the anti-correlation between the total fractional rms and the characteristic frequency, suggest that these QPOs are type-C QPOs, which is consistent with the detection of these QPOs during the hard state.
The properties of the energy spectra obtained from NICER data confirm that Swift J1727.7–1613 is in the LHS or HIMS during these observations. The observed photon index increases from 1.6 to 2.3 and the disc temperature is rather low, with values between 0.2 and 0.5 keV.
In the Swift/XRT observations on days 27 and 30, QPOs with a characteristic frequency of ∼5 Hz are observed. These oscillations are type-B QPOs, indicating that Swift J1727.7–1613 is in the SIMS. On day 34, the source returned to the HIMS, showing a type-C QPO with a characteristic frequency of 4.34 ± 0.05 Hz. Further (type-B) QPOs with a characteristic frequency between 6.4 and 7.1 Hz are observed in NICER PDS between days 39 and 42. It is known that black hole LMXBs can go back and forth a few times between the HIMS and SIMS, leading to the idea that the type-C and type-B QPOs observed in these states, respectively, are caused by two distinct mechanisms (Motta et al. 2011) (for a recent study on transitions in the IMSs of GX 339-4 using NICER, refer to Stiele & Kong 2023). Therefore, the return to the HIMS on day 34 is typical behaviour for a black hole LMXB. Swift J1727.7–1613 then enters into the soft state, where no QPOs are observed.
Between days 6 and 16, there is little overall evolution in the characteristic frequency of the type-C QPOs, with an increase in the frequency of the fundamental QPO from ∼1.1 to ∼1.5 Hz (see also Mereminskiy et al. 2024). Superimposed on this plateau are faster fluctuations in the characteristic frequency, especially on day 12 where the frequency evolves in a similar range just within one day. The PDS obtained from NICER observations between days 19 and 23 show an overall increase in the characteristic frequency of the type-C QPO that is again superimposed by faster fluctuations in the frequency.
Within the Lense-Thirring precession of a hot inner flow in a truncated accretion disc, the frequency of the fundamental type-C QPO can be translated into the outer radius of the hot flow. Following the equations given in Ingram et al. (2009) and assuming a black hole of ten solar masses and a spin parameter of a = 0.9, we derived these radii from the observed QPO frequencies. The radii obtained from the characteristic frequency of the fundamental QPO can be compared to the one derived from the normalisation of the diskbb model. For the later ones, we used a distance of 2.7 ± 0.3 kpc (Mata Sánchez et al. 2024) and assumed an inclination of  (Draghis et al. 2023; Peng et al. 2024). From the upper panel of Fig. 4, we see that the overall trend of the radii obtained by the two methods are similar, especially for observations up until day 16. During the plateau in the QPO frequency between days 6 and 16 the evolution of the inner disc radius obtained from spectral fits of the NICER observations fluctuates around a plateau of ∼154 km. In Fig. 7, we plot the two radii versus each other and find a tight correlation between them that holds for the overall long-term evolution as well as for the evolution on a timescale of hours within one day. The consistent co-evolution of the inner disc radii and the outer radii of the accretion flow supports the Lense-Thirring precession interpretation. Nevertheless, there remains the challenge of explaining how the rather fast changes in the QPO frequency and disc radius on a timescale of hours go together with the much slower and steadier evolution of these properties on timescales of days. The data points for observations after day 39 do not seem to follow the correlation, which can be addressed by the fact that the type-B QPOs that are present in these observations are thought to be caused by a different mechanism than Lense-Thirring precession. During the SIMS when type-B QPOs exist, it is assumed that the truncation radius of the disc moves inwards, while the hot flow disappears. We have refrained from comparing the numerical values of the radii determined with the two different methods, as these values depend on the assumed parameters.
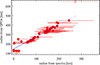 |
Fig. 7. Outer radii of the hot inner flow obtained from the characteristic frequency of the fundamental QPO vs inner disc radii obtained from spectral fits. There is a tight correlation between these two radii for observations in which type-C QPOs are observed, which holds on timescales of hours as well as days. The dashed (blue) line indicates the best-fitting linear correlation using only observations in which the fundamental QPO is detected with more than 3σ (filled circles). |
The spectral properties of observations taken after day 39 confirm that Swift J1727.7–1613 went into softer states during these observations, as the disc temperature increased to values between 0.6 keV and 0.9 keV. For the photon index, rather high values between 3 and 4 are observed. In observations in which type-B QPOs are found, the source resides in the SIMS.
Data availability
Tables 1 and 2, providing detailed information about the parameters of the fundamental QPO and its harmonic obtained from NICER observations, are available on Zenodo: https://zenodo.org/records/13897907
The documentation of the SCORPEON background model, which can be found here: https://heasarc.gsfc.nasa.gov/docs/nicer/analysis_threads/scorpeon-xspec/, recommends to use a broad energy range to constrain the parameters of this background model well.
Acknowledgments
We acknowledge that this research makes use of SciServer, a resource developed and operated by the Johns Hopkins University, Institute for Data Intensive Engineering and Science (IDIES). HS acknowledges support from the “Big Bang to Big Data” (B3D) project, the NRW cluster for data-intensive radio astronomy, funded by the state of North Rhine-Westphalia as part of the Profiling 2020 programme. AK acknowledges support by the Ministry of Science and Technology of the Republic of China (Taiwan) through grants 110-2628-M-007-005 and 111-2112-M-007-020. This research has made use of data obtained through the High Energy Astrophysics Science Archive Research Center Online Service, provided by the NASA/Goddard Space Flight Center.
References
- Alabarta, K., Altamirano, D., Méndez, M., et al. 2020, MNRAS, 497, 3896 [NASA ADS] [CrossRef] [Google Scholar]
- Arnaud, K. A. 1996, ASP Conf. Ser., 101, 17 [Google Scholar]
- Baglio, M. C., Casella, P., Testa, V., et al. 2023, ATel., 16225, 1 [NASA ADS] [Google Scholar]
- Belloni, T. M. 2010, in States and Transitions in Black Hole Binaries, ed. T. Belloni (Berlin, Heidelberg: Springer-Verlag), 794, 53 [Google Scholar]
- Belloni, T., & Hasinger, G. 1990, A&A, 227, L33 [NASA ADS] [Google Scholar]
- Belloni, T. M., & Stella, L. 2014, Space Sci. Rev., 183, 43 [NASA ADS] [CrossRef] [Google Scholar]
- Belloni, T., Psaltis, D., & van der Klis, M. 2002, ApJ, 572, 392 [NASA ADS] [CrossRef] [Google Scholar]
- Belloni, T., Homan, J., Casella, P., et al. 2005, A&A, 440, 207 [NASA ADS] [CrossRef] [EDP Sciences] [Google Scholar]
- Belloni, T., Parolin, I., Del Santo, M., et al. 2006, MNRAS, 367, 1113 [NASA ADS] [CrossRef] [Google Scholar]
- Belloni, T. M., Motta, S. E., & Muñoz-Darias, T. 2011, Bull. Astron. Soc. India, 39, 409 [Google Scholar]
- Burrows, D. N., Hill, J. E., Nousek, J. A., et al. 2005, Space Sci. Rev., 120, 165 [Google Scholar]
- Casella, P., Belloni, T., & Stella, L. 2005, ApJ, 629, 403 [Google Scholar]
- Castro-Tirado, A. J., Sanchez-Ramirez, R., Caballero-Garcia, M. D., et al. 2023, ATel., 16208, 1 [NASA ADS] [Google Scholar]
- De Rosa, A., Uttley, P., Gou, L., et al. 2019, Sci. China Phys. Mech. Astron., 62, 29504 [NASA ADS] [CrossRef] [Google Scholar]
- Done, C., & Diaz Trigo, M. 2010, MNRAS, 407, 2287 [NASA ADS] [CrossRef] [Google Scholar]
- Done, C., Gierliński, M., & Kubota, A. 2007, A&ARv., 15, 1 [NASA ADS] [CrossRef] [Google Scholar]
- Dovciak, M., Ratheesh, A., Tennant, A., & Ma, G. 2023, ATel., 16242, 1 [NASA ADS] [Google Scholar]
- Draghis, P. A., Miller, J. M., Homan, J., et al. 2023, ATel., 16219, 1 [NASA ADS] [Google Scholar]
- Esin, A. A., McClintock, J. E., & Narayan, R. 1997, ApJ, 489, 865 [NASA ADS] [CrossRef] [Google Scholar]
- Esin, A. A., McClintock, J. E., Drake, J. J., et al. 2001, ApJ, 555, 483 [NASA ADS] [CrossRef] [Google Scholar]
- Evans, P. A., Beardmore, A. P., Page, K. L., et al. 2009, MNRAS, 397, 1177 [Google Scholar]
- Fabian, A. C., Buisson, D. J., Kosec, P., et al. 2020, MNRAS, 493, 5389 [NASA ADS] [CrossRef] [Google Scholar]
- Fender, R. P., Homan, J., & Belloni, T. M. 2009, MNRAS, 396, 1370 [NASA ADS] [CrossRef] [Google Scholar]
- Gendreau, K. C., Arzoumanian, Z., & Okajima, T. 2012, Proc. SPIE, 8443, 844313D [NASA ADS] [CrossRef] [Google Scholar]
- Gierliński, M., & Done, C. 2004, MNRAS, 347, 885 [Google Scholar]
- Gierliński, M., & Newton, J. 2006, MNRAS, 370, 837 [CrossRef] [Google Scholar]
- Gilfanov, M. 2010, in X-Ray Emission from Black-Hole Binaries, ed. T. Belloni, 794, 17 [Google Scholar]
- Homan, J., & Belloni, T. 2005, Ap&SS, 300, 107 [Google Scholar]
- Homan, J., Wijnands, R., van der Klis, M., et al. 2001, ApJS, 132, 377 [NASA ADS] [CrossRef] [Google Scholar]
- Ingram, A., Done, C., & Fragile, P. C. 2009, MNRAS, 397, L101 [Google Scholar]
- Ingram, A., Bollemeijer, N., Veledina, A., et al. 2024, ApJ, 968, 76 [NASA ADS] [CrossRef] [Google Scholar]
- Kaastra, J. S., & Bleeker, J. A. M. 2016, A&A, 587, A151 [NASA ADS] [CrossRef] [EDP Sciences] [Google Scholar]
- Kalamkar, M., van der Klis, M., Uttley, P., Altamirano, D., & Wijnands, R. 2013, ApJ, 766, 89 [NASA ADS] [CrossRef] [Google Scholar]
- Kolehmainen, M., Done, C., & Díaz Trigo, M. 2014, MNRAS, 437, 316 [NASA ADS] [CrossRef] [Google Scholar]
- Leahy, D. A., Elsner, R. F., & Weisskopf, M. C. 1983, ApJ, 272, 256 [Google Scholar]
- Liu, H. Y., Li, D. Y., Pan, H. W., et al. 2023, ATel., 16210, 1 [Google Scholar]
- Mastichiadis, A., Petropoulou, M., & Kylafis, N. D. 2022, A&A, 662, A118 [NASA ADS] [CrossRef] [EDP Sciences] [Google Scholar]
- Mata Sánchez, D., Muñoz-Darias, T., Armas Padilla, M., Casares, J., & Torres, M. A. P. 2024, A&A, 682, L1 [NASA ADS] [CrossRef] [EDP Sciences] [Google Scholar]
- McClintock, J. E., & Remillard, R. A. 2006, Cambridge Astrophys. Ser., 39, 157 [NASA ADS] [Google Scholar]
- McClintock, J. E., Narayan, R., & Steiner, J. F. 2014, Space Sci. Rev., 183, 295 [NASA ADS] [CrossRef] [Google Scholar]
- Mereminskiy, I., Lutovinov, A., Molkov, S., et al. 2024, MNRAS, 531, 4893 [NASA ADS] [CrossRef] [Google Scholar]
- Miller, J. M., Homan, J., Steeghs, D., et al. 2006, ApJ, 653, 525 [NASA ADS] [CrossRef] [Google Scholar]
- Mitsuda, K., Inoue, H., Koyama, K., et al. 1984, PASJ, 36, 741 [NASA ADS] [Google Scholar]
- Motta, S., Muñoz-Darias, T., Casella, P., Belloni, T., & Homan, J. 2011, MNRAS, 418, 2292 [NASA ADS] [CrossRef] [Google Scholar]
- Muñoz-Darias, T., Motta, S., & Belloni, T. M. 2011, MNRAS, 410, 679 [Google Scholar]
- Nakahira, S., Koyama, S., Ueda, Y., et al. 2012, PASJ, 64, 13 [NASA ADS] [Google Scholar]
- Nampalliwar, S., & Bambi, C. 2018, ArXiv e-prints [arXiv:1810.07041] [Google Scholar]
- Narayan, R., & Yi, I. 1995, ApJ, 452, 710 [NASA ADS] [CrossRef] [Google Scholar]
- Negoro, H., Serino, M., Nakajima, M., et al. 2023, ATel., 16205, 1 [NASA ADS] [Google Scholar]
- Nowak, M. A. 2000, MNRAS, 318, 361 [NASA ADS] [CrossRef] [Google Scholar]
- O’Connor, B., Hare, J., Younes, G., et al. 2023, ATel., 16207, 1 [Google Scholar]
- Page, K. L., Dichiara, S., Gropp, J. D., et al. 2023, GRB Coordinates Network, 34537, 1 [NASA ADS] [Google Scholar]
- Palmer, D. M., & Parsotan, T. M. 2023, ATel., 16215, 1 [Google Scholar]
- Peng, J.-Q., Zhang, S., Shui, Q.-C., et al. 2024, ApJ, 960, L17 [CrossRef] [Google Scholar]
- Petrucci, P.-O., Cabanac, C., Corbel, S., Koerding, E., & Fender, R. 2014, A&A, 564, A37 [NASA ADS] [CrossRef] [EDP Sciences] [Google Scholar]
- Plant, D. S., Fender, R. P., Ponti, G., Muñoz-Darias, T., & Coriat, M. 2015, A&A, 573, A120 [NASA ADS] [CrossRef] [EDP Sciences] [Google Scholar]
- Rao, F., Belloni, T., Stella, L., Zhang, S. N., & Li, T. 2010, ApJ, 714, 1065 [NASA ADS] [CrossRef] [Google Scholar]
- Shakura, N. I., & Sunyaev, R. A. 1973, A&A, 500, 33 [NASA ADS] [Google Scholar]
- Steiner, J. F., McClintock, J. E., Remillard, R. A., et al. 2010, ApJ, 718, L117 [Google Scholar]
- Stella, L., & Vietri, M. 1998, ApJ, 492, L59 [NASA ADS] [CrossRef] [Google Scholar]
- Stiele, H., & Kong, A. K. H. 2018, ApJ, 868, 71 [NASA ADS] [CrossRef] [Google Scholar]
- Stiele, H., & Kong, A. K. H. 2020, ApJ, 889, 142 [NASA ADS] [CrossRef] [Google Scholar]
- Stiele, H., & Kong, A. K. H. 2021, ApJ, 914, 93 [NASA ADS] [CrossRef] [Google Scholar]
- Stiele, H., & Kong, A. K. H. 2023, MNRAS, 522, 268 [CrossRef] [Google Scholar]
- Stiele, H., & Yu, W. 2015, MNRAS, 452, 3666 [NASA ADS] [CrossRef] [Google Scholar]
- Sunyaev, R. A., Mereminskiy, I. A., Molkov, S. V., et al. 2023, ATel., 16217, 1 [Google Scholar]
- van der Klis, M. 1989, NATO Adv. Study Inst. (ASI) Ser. C, 262, 27 [Google Scholar]
- van der Klis, M. 1994a, A&A, 283, 469 [NASA ADS] [Google Scholar]
- van der Klis, M. 1994b, ApJS, 92, 511 [NASA ADS] [CrossRef] [Google Scholar]
- Verner, D. A., Ferland, G. J., Korista, K. T., & Yakovlev, D. G. 1996, ApJ, 465, 487 [Google Scholar]
- Wang, Y. D., & Bellm, E. C. 2023, ATel., 16209, 1 [NASA ADS] [Google Scholar]
- Wijnands, R., & van der Klis, M. 1999, ApJ, 514, 939 [NASA ADS] [CrossRef] [Google Scholar]
- Wilms, J., Allen, A., & McCray, R. 2000, ApJ, 542, 914 [Google Scholar]
- Yao, Y., Kulkarni, S. R., Gendreau, K. C., et al. 2021, ApJ, 920, 121 [NASA ADS] [CrossRef] [Google Scholar]
- Zdziarski, A. A., Johnson, W. N., & Magdziarz, P. 1996, MNRAS, 283, 193 [NASA ADS] [CrossRef] [Google Scholar]
- Zhang, W., Jahoda, K., Swank, J. H., Morgan, E. H., & Giles, A. B. 1995, ApJ, 449, 930 [NASA ADS] [CrossRef] [Google Scholar]
- Zhang, L., Altamirano, D., Cúneo, V. A., et al. 2020, MNRAS, 499, 851 [NASA ADS] [CrossRef] [Google Scholar]
- Życki, P. T., Done, C., & Smith, D. A. 1999, MNRAS, 309, 561 [Google Scholar]
All Figures
|
Fig. 1. Light curve of the 2023 outburst of Swift J1727.7–1613 based on Swift/XRT and NICER data. Each data point represents one observation. T=0 corresponds to August 24 2023 00:00:00.000 UTC. |
| In the text | |
|
Fig. 2. Hardness intensity diagram (upper panel) and hardness rms diagram (lower panel), derived using Swift/XRT (left panels) and NICER (right panels) data. Each data point represents one observation. In the HID based on NICER data, we include further observations (grey points) to show that the overall evolution of the source shows the q-shape typically seen in HIDs of black hole LMXBs. The first observation is marked with a (black) star. Observations in which type-C QPOs are detected are marked by down-pointing triangles, while observations in which type-B QPOs are detected are marked by up-pointing triangles. The triangles are filled when the feature is detected with ≥3σ. |
| In the text | |
|
Fig. 3. Total rms intensity diagram, derived using Swift/XRT (upper panel) and NICER (lower panel) data. Each data point represents one observation. The symbols are the same as in Fig. 2. |
| In the text | |
|
Fig. 4. Evolution of QPO frequencies (lower panel) and of outer hot flow and inner disc radii, respectively (upper panel). Lower panel: Evolution of the characteristic frequency of the QPOs during the outburst. Circles indicate fundamental QPOs from NICER observations, while down-pointing triangles indicate upper harmonics. Fundamental QPOs from Swift/XRT observations are indicated by squares. Upper panel: Comparison of the radius derived from the characteristic frequency of the fundamental QPO following Ingram et al. (2009) and from the normalisation of the diskbb model (Mitsuda et al. 1984) fitted to the energy spectra obtained from NICER observations. The inset exemplifies the evolution within one day. In both panels, filled symbols indicate observations or snapshots in which the QPO is observed at ≥3σ. |
| In the text | |
|
Fig. 5. Correlation of the broadband fractional rms variability with the characteristic QPO frequency derived from NICER and Swift/XRT data. The symbols are the same as in the lower panel of Fig. 4. |
| In the text | |
|
Fig. 6. Evolution of spectral parameters, fitting NICER spectra with an absorbed disc blackbody and Comptonisation model. Given parameters are (from top to bottom): foreground absorption, inner disc temperature, inner disc radius, photon index, nthcomp normalisation, and reduced χ2. The electron temperature is not shown as it is not well constrained. |
| In the text | |
|
Fig. 7. Outer radii of the hot inner flow obtained from the characteristic frequency of the fundamental QPO vs inner disc radii obtained from spectral fits. There is a tight correlation between these two radii for observations in which type-C QPOs are observed, which holds on timescales of hours as well as days. The dashed (blue) line indicates the best-fitting linear correlation using only observations in which the fundamental QPO is detected with more than 3σ (filled circles). |
| In the text | |
Current usage metrics show cumulative count of Article Views (full-text article views including HTML views, PDF and ePub downloads, according to the available data) and Abstracts Views on Vision4Press platform.
Data correspond to usage on the plateform after 2015. The current usage metrics is available 48-96 hours after online publication and is updated daily on week days.
Initial download of the metrics may take a while.