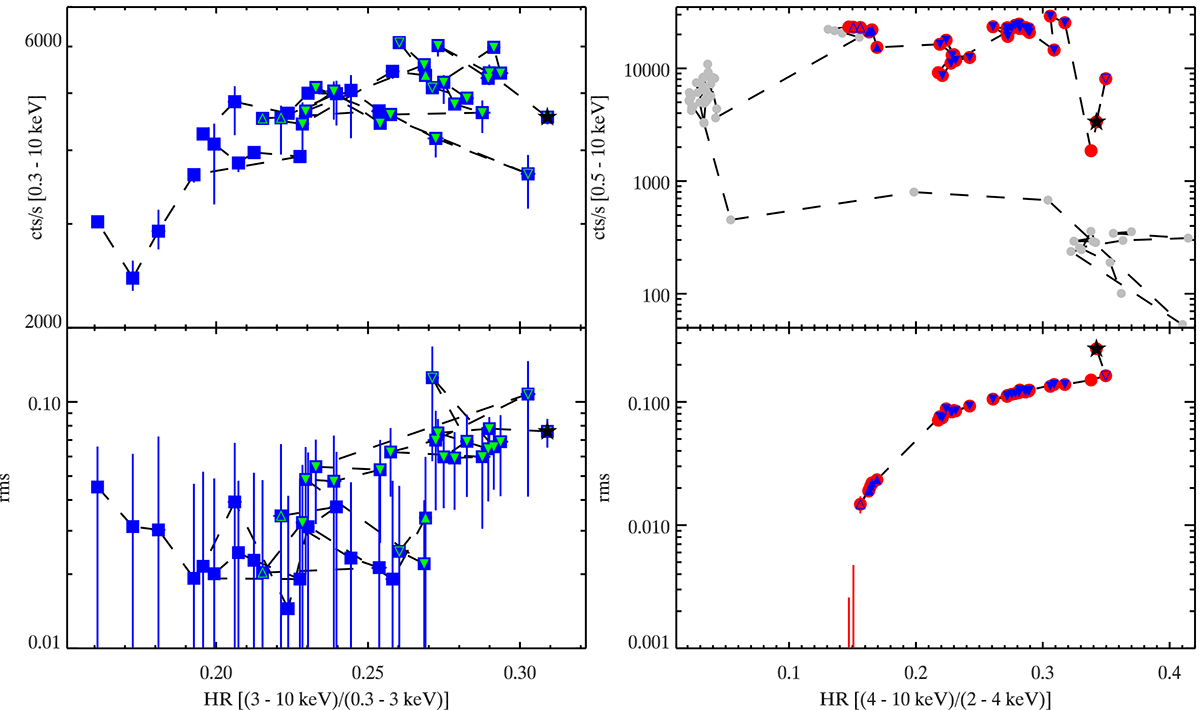
Fig. 2.
Download original image
Hardness intensity diagram (upper panel) and hardness rms diagram (lower panel), derived using Swift/XRT (left panels) and NICER (right panels) data. Each data point represents one observation. In the HID based on NICER data, we include further observations (grey points) to show that the overall evolution of the source shows the q-shape typically seen in HIDs of black hole LMXBs. The first observation is marked with a (black) star. Observations in which type-C QPOs are detected are marked by down-pointing triangles, while observations in which type-B QPOs are detected are marked by up-pointing triangles. The triangles are filled when the feature is detected with ≥3σ.
Current usage metrics show cumulative count of Article Views (full-text article views including HTML views, PDF and ePub downloads, according to the available data) and Abstracts Views on Vision4Press platform.
Data correspond to usage on the plateform after 2015. The current usage metrics is available 48-96 hours after online publication and is updated daily on week days.
Initial download of the metrics may take a while.