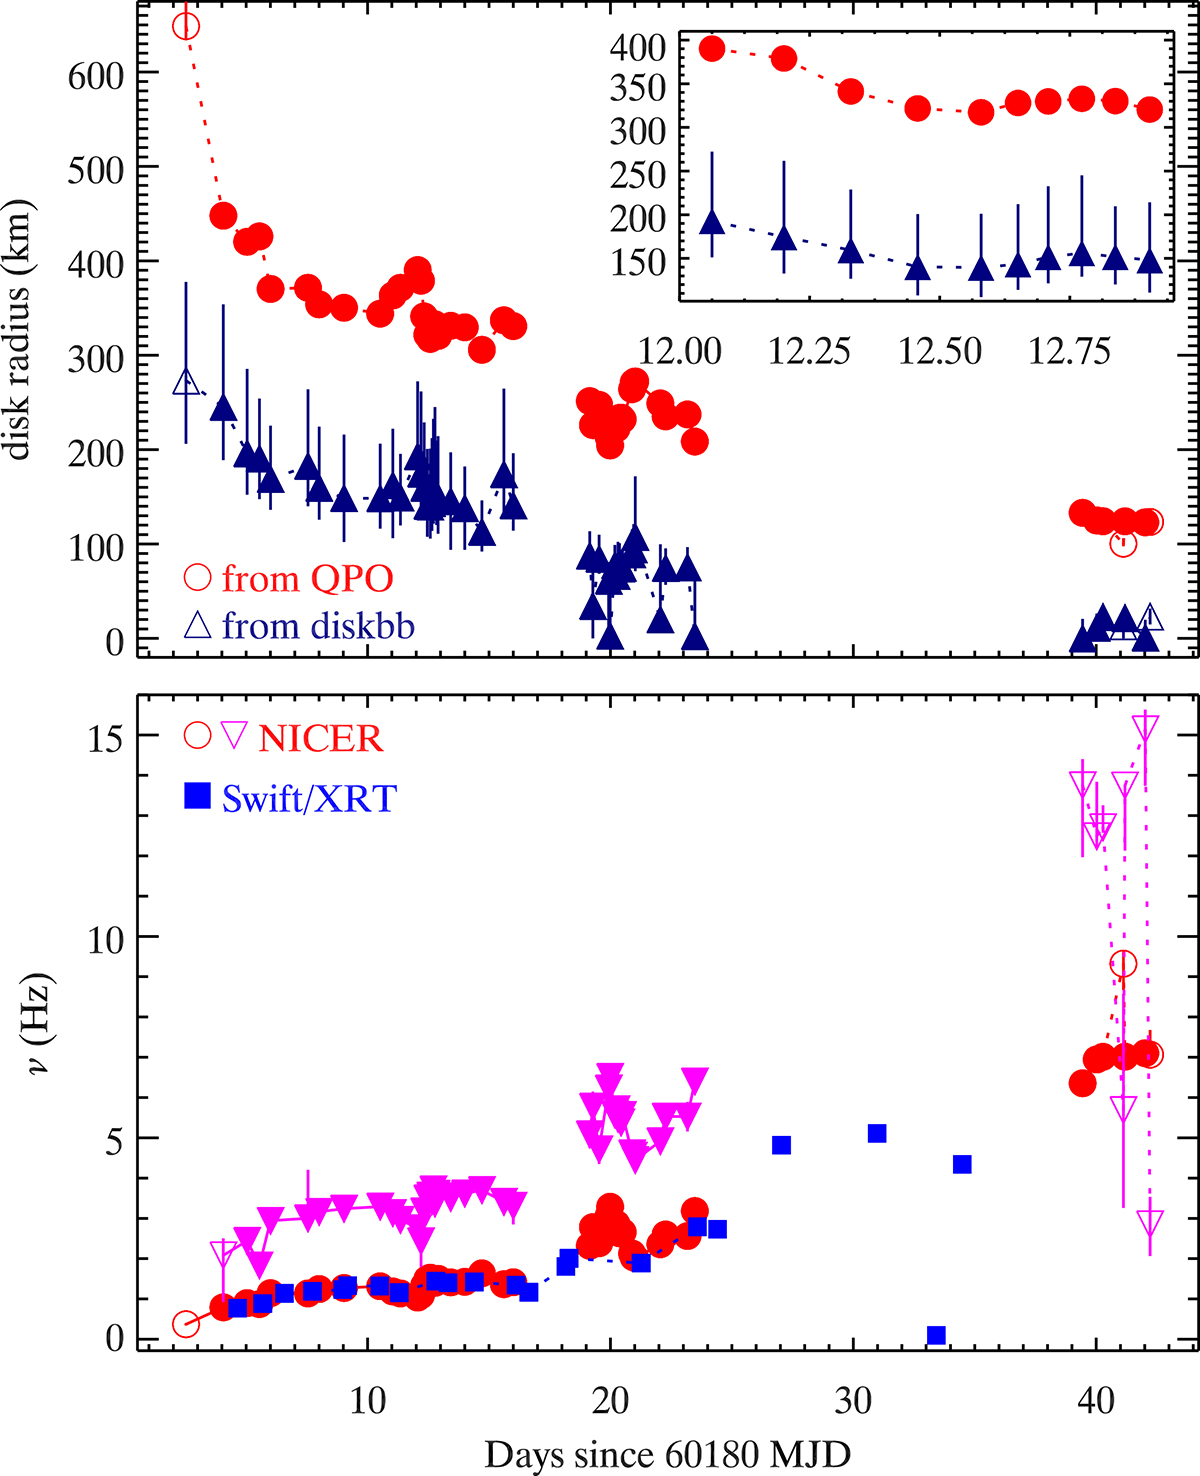
Fig. 4.
Download original image
Evolution of QPO frequencies (lower panel) and of outer hot flow and inner disc radii, respectively (upper panel). Lower panel: Evolution of the characteristic frequency of the QPOs during the outburst. Circles indicate fundamental QPOs from NICER observations, while down-pointing triangles indicate upper harmonics. Fundamental QPOs from Swift/XRT observations are indicated by squares. Upper panel: Comparison of the radius derived from the characteristic frequency of the fundamental QPO following Ingram et al. (2009) and from the normalisation of the diskbb model (Mitsuda et al. 1984) fitted to the energy spectra obtained from NICER observations. The inset exemplifies the evolution within one day. In both panels, filled symbols indicate observations or snapshots in which the QPO is observed at ≥3σ.
Current usage metrics show cumulative count of Article Views (full-text article views including HTML views, PDF and ePub downloads, according to the available data) and Abstracts Views on Vision4Press platform.
Data correspond to usage on the plateform after 2015. The current usage metrics is available 48-96 hours after online publication and is updated daily on week days.
Initial download of the metrics may take a while.