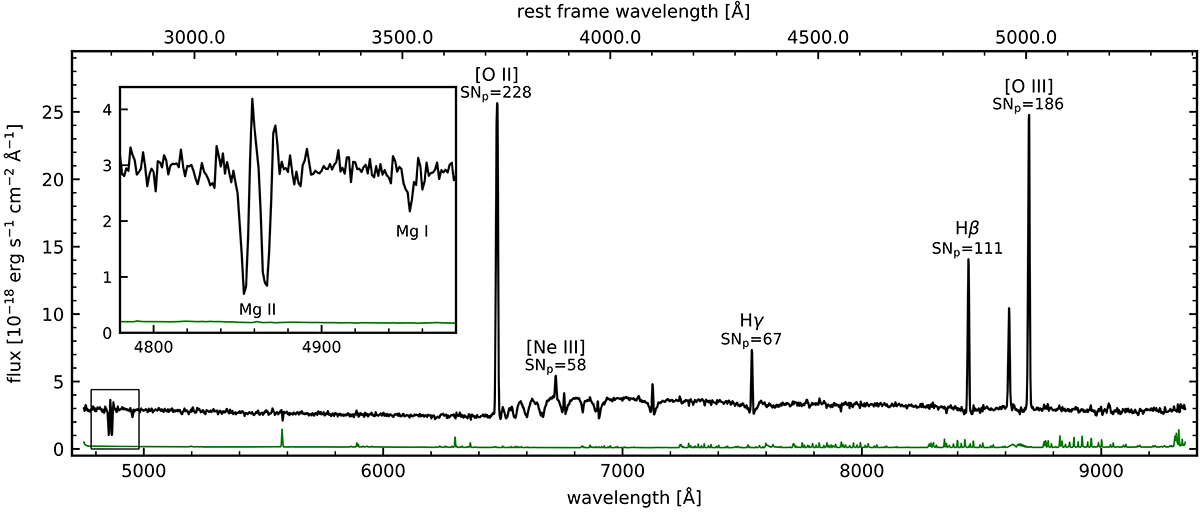
Fig. 2.
Download original image
Integrated MUSE spectrum of the galaxy #884 within an aperture of 1″ radius, slightly smoothed for display purposes. The Mg IIλλ2796, 2803 doublet and the neighboring Mg Iλ2852 line are indicated by the box; an unsmoothed zoom into this spectral region is shown in the inset panel. The green line at the bottom traces the 1σ uncertainty spectrum and indicates the locations of bright sky emission. Other prominent emission lines in the spectrum are labeled, with their corresponding peak signal-to-noise ratio SNp.
Current usage metrics show cumulative count of Article Views (full-text article views including HTML views, PDF and ePub downloads, according to the available data) and Abstracts Views on Vision4Press platform.
Data correspond to usage on the plateform after 2015. The current usage metrics is available 48-96 hours after online publication and is updated daily on week days.
Initial download of the metrics may take a while.