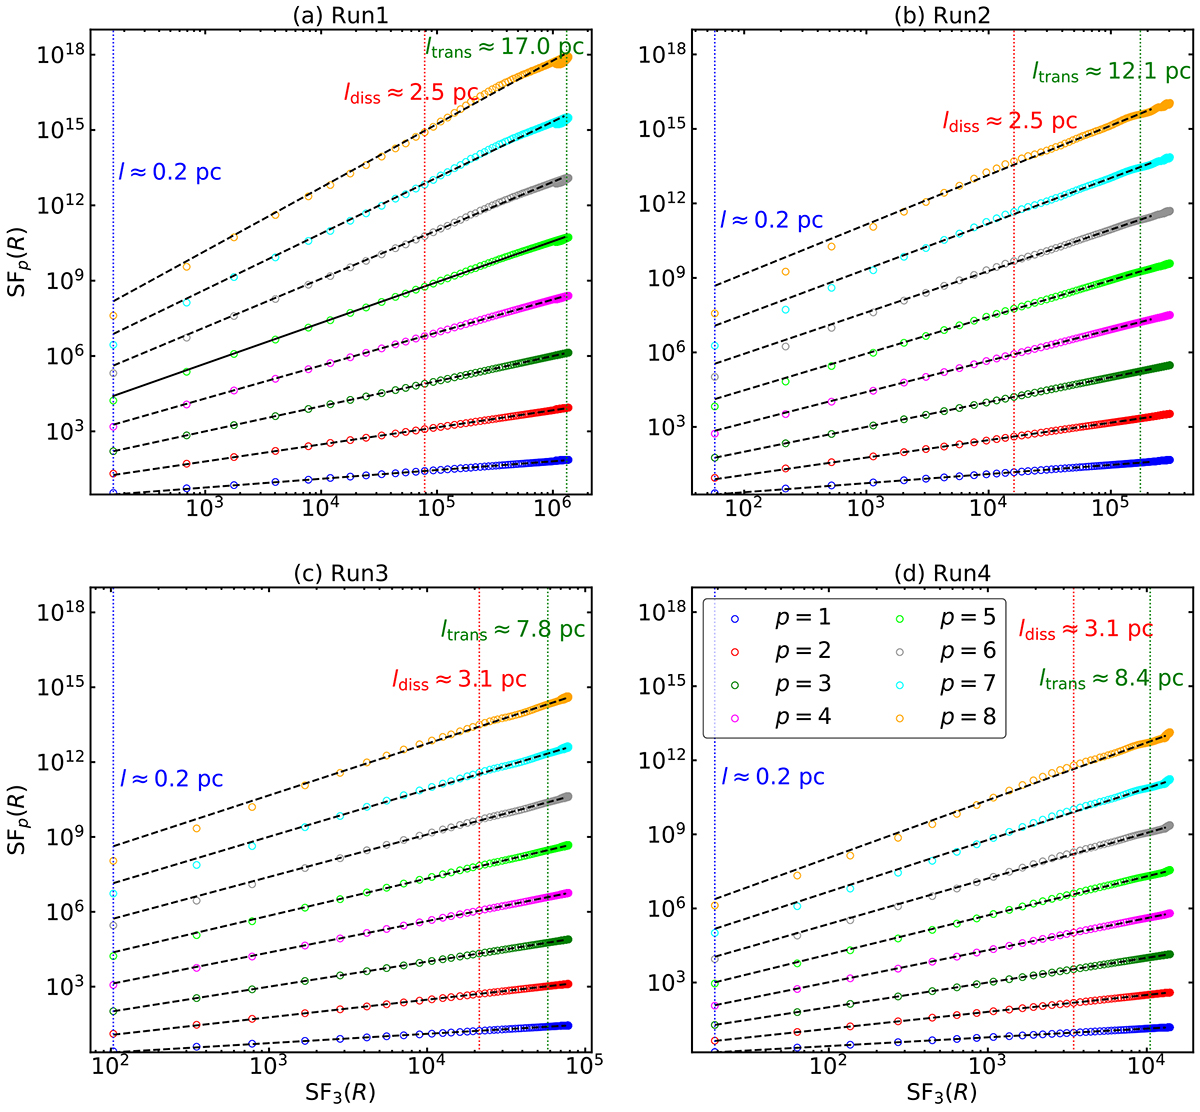
Fig. A.1.
Download original image
Structure functions of the SPI with different orders (from p = 1 to 8) as a function of SF3(R) under the extended self-similarity hypothesis. The vertical blue, green, and red dotted lines denote the values of third-order structure function in the smallest resolved spatial length, transition scale, and dissipation scale, respectively. The black dashed lines show a linear fit to the structure function on log-log scales.
Current usage metrics show cumulative count of Article Views (full-text article views including HTML views, PDF and ePub downloads, according to the available data) and Abstracts Views on Vision4Press platform.
Data correspond to usage on the plateform after 2015. The current usage metrics is available 48-96 hours after online publication and is updated daily on week days.
Initial download of the metrics may take a while.