Open Access
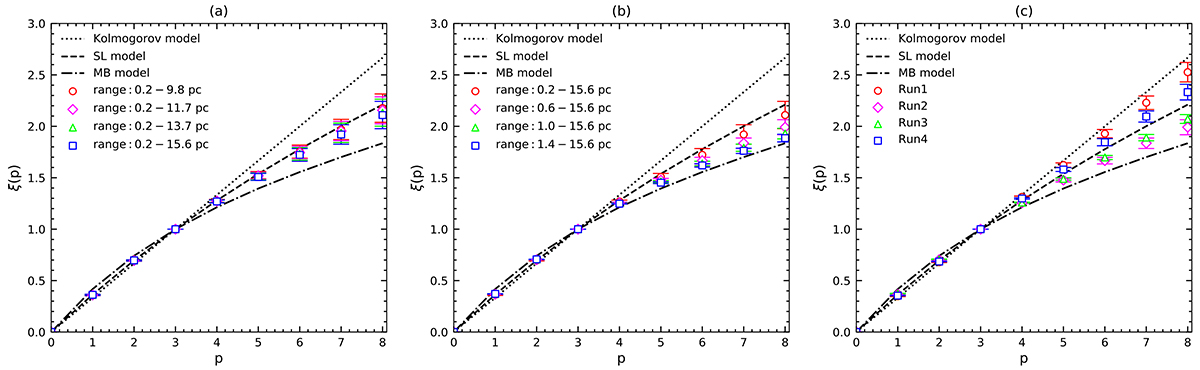
Fig. 3.
Download original image
Scaling exponent as a function of the order for the SPI at three scenarios: the lower limits of the fixed R (panel (a)), the upper limits of the fixed R (panel (b)), and different turbulence models (panel (c)). The results of panels (a) and (b) are obtained by Run2.
Current usage metrics show cumulative count of Article Views (full-text article views including HTML views, PDF and ePub downloads, according to the available data) and Abstracts Views on Vision4Press platform.
Data correspond to usage on the plateform after 2015. The current usage metrics is available 48-96 hours after online publication and is updated daily on week days.
Initial download of the metrics may take a while.