Fig. 9
Download original image
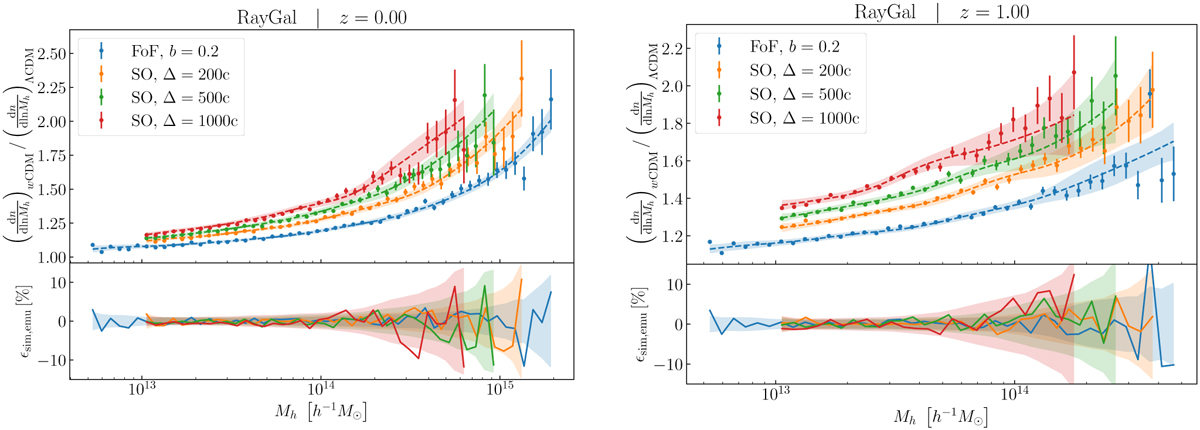
Comparison of the e-MANTIS predictions for the ratio of the HMFs from the two RayGal simulations for different halo definitions at z = 0 (left) and z = 1 (right). Both RayGal simulations differ not only in the value of w, but also in terms of Ωm and ![]() . Top panel: ratio of the HMFs from the two RayGal simulations (solid circles) and predictions from the emulator (dashed lines). The noise in the simulation measurements and the emulator predictions are given as error bars and a shaded area respectively around the corresponding lines (not always visible for small errors). Bottom panel: relative difference between the simulation measurements and the emulator predictions. The shaded area marks the 1σ confidence interval, combining both the simulation data noise and the emulator accuracy.
. Top panel: ratio of the HMFs from the two RayGal simulations (solid circles) and predictions from the emulator (dashed lines). The noise in the simulation measurements and the emulator predictions are given as error bars and a shaded area respectively around the corresponding lines (not always visible for small errors). Bottom panel: relative difference between the simulation measurements and the emulator predictions. The shaded area marks the 1σ confidence interval, combining both the simulation data noise and the emulator accuracy.
Current usage metrics show cumulative count of Article Views (full-text article views including HTML views, PDF and ePub downloads, according to the available data) and Abstracts Views on Vision4Press platform.
Data correspond to usage on the plateform after 2015. The current usage metrics is available 48-96 hours after online publication and is updated daily on week days.
Initial download of the metrics may take a while.