Fig. 6
Download original image
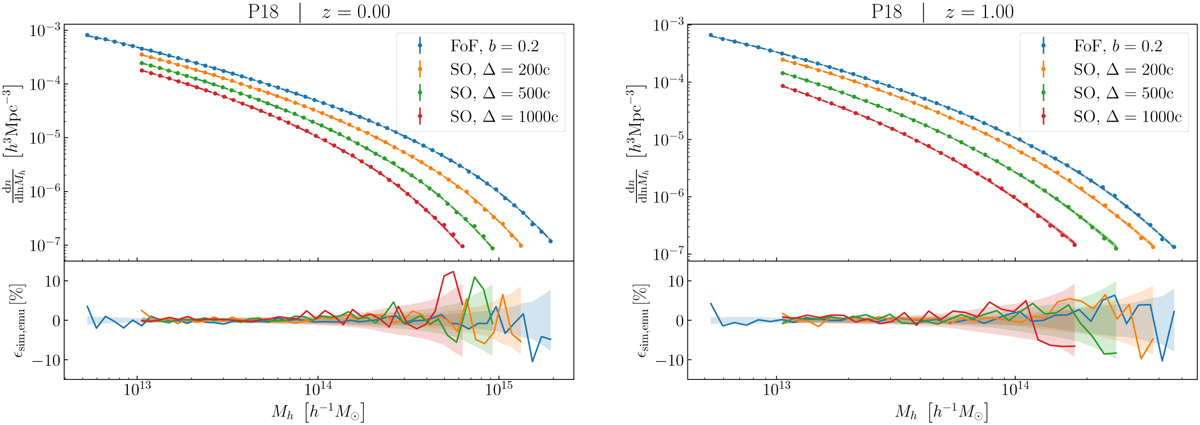
Comparison of the emulator HMF predictions to the L328_M10_P18 simulation at z = 0 (left) and z = 1 (right). Top panels: HMFs measured from the simulation (solid circles) and emulator predictions (dashed lines) without resolution correction, such as to consistently match the resolution of the L328_M10_P18 simulation. The different colours correspond to the different halo mass definitions. The error bars correspond to the HMF simulation measurement errors, while the shaded area around the lines correspond to the uncertainties of HMF emulator predictions (not visible due to the small level of uncertainty). Bottom panels: relative difference between the simulation measurements and the emulator predictions. The shaded area correspond to the Iσ confidence interval combining both the simulation noise and the emulator accuracy. There is a good agreement with differences of the order of a few percent level, and within the expected error bars.
Current usage metrics show cumulative count of Article Views (full-text article views including HTML views, PDF and ePub downloads, according to the available data) and Abstracts Views on Vision4Press platform.
Data correspond to usage on the plateform after 2015. The current usage metrics is available 48-96 hours after online publication and is updated daily on week days.
Initial download of the metrics may take a while.