Fig. 5
Download original image
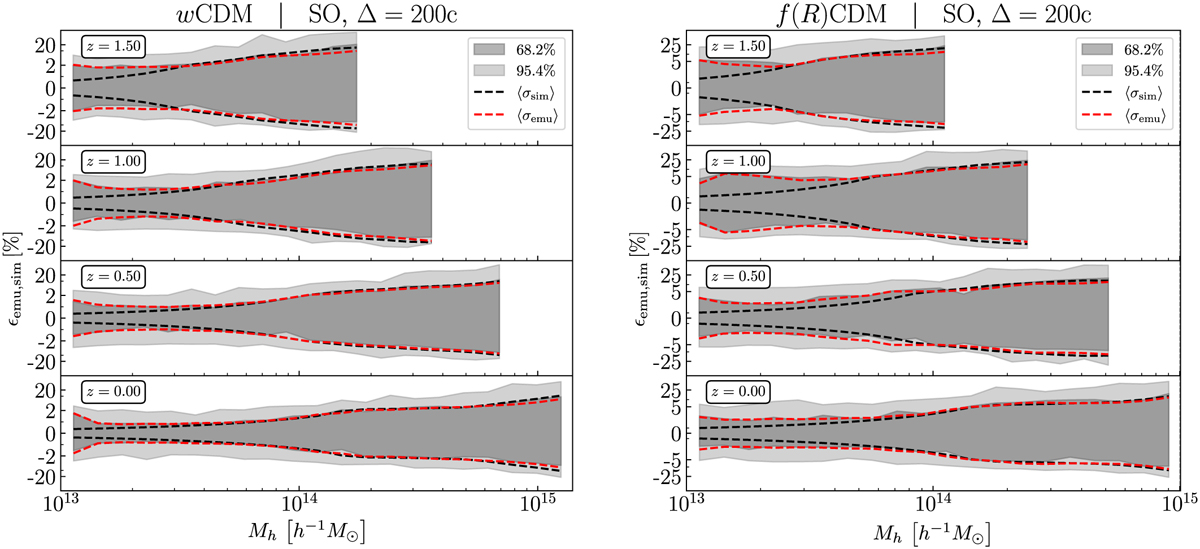
Results of the leave-one-out test for the wCDM (left) and f(R)CDM (right) cosmologies, for multiple redshifts, and in the case of the SO HMF with ∆ = 200c. One model is excluded from the emulator training set, the corresponding predictions are compared to the simulation measurements of this model. The procedure is repeated for each of the 80 training models. The light and dark shaded areas mark the 68.2% and 95.4% confidence intervals of the resulting distribution of relative errors. The black dashed line gives the 1σ error from the simulation measurements, averaged over all cosmological models. The red dashed line indicates the 1σ emulation error estimated by the emulator itself, averaged over all cosmological models. In the left plot, the y-axis scaling is linear within the ±2% region and logarithmic outside. In the right plot, the y-axis scaling is linear within the ±5% region and logarithmic outside.
Current usage metrics show cumulative count of Article Views (full-text article views including HTML views, PDF and ePub downloads, according to the available data) and Abstracts Views on Vision4Press platform.
Data correspond to usage on the plateform after 2015. The current usage metrics is available 48-96 hours after online publication and is updated daily on week days.
Initial download of the metrics may take a while.