Fig. 4
Download original image
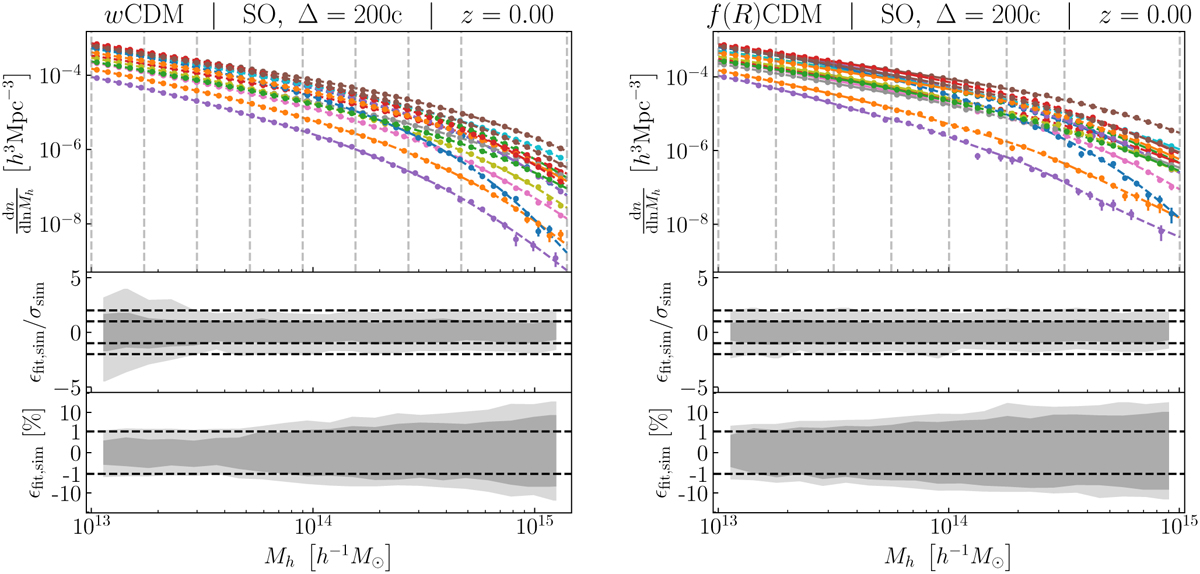
B-spline decomposition of the HMF for SO haloes with ∆ = 200c at z = 0 in wCDM (left) and f(R)CDM (right) cosmologies. Top panel: measured HMF from the simulations (data points), with the corresponding errors bars (not always visible), and B-spline function fits (dashed lines). Each colour corresponds to a different training model. For visual clarity, only the models from the first slice of the quasi-PLHS are displayed (i.e. 16 models). The dashed vertical lines indicate the location of the B-spline knots. Middle panel: distribution of the fit residuals normalized by the noise in the simulation data. The dark and light shaded areas mark the 68.2% and 95.4% confidence intervals, respectively. The dashed lines indicate the ±1 and ±2σ levels. Bottom panel: distribution of the fit residuals normalized by the simulation data (i.e. the relative errors). The dark and light shaded areas mark the 68.2% and 95.4% confidence intervals, respectively. The shaded region corresponds to the ±1% level, along the y-axis the scaling is linear within the 1% region and logarithmic outside. The uncertainties on the B-spline fits are dominated by the simulation noise, except in the wCDM case at small masses, where they saturate at the ~0.5% level.
Current usage metrics show cumulative count of Article Views (full-text article views including HTML views, PDF and ePub downloads, according to the available data) and Abstracts Views on Vision4Press platform.
Data correspond to usage on the plateform after 2015. The current usage metrics is available 48-96 hours after online publication and is updated daily on week days.
Initial download of the metrics may take a while.