Fig. 2
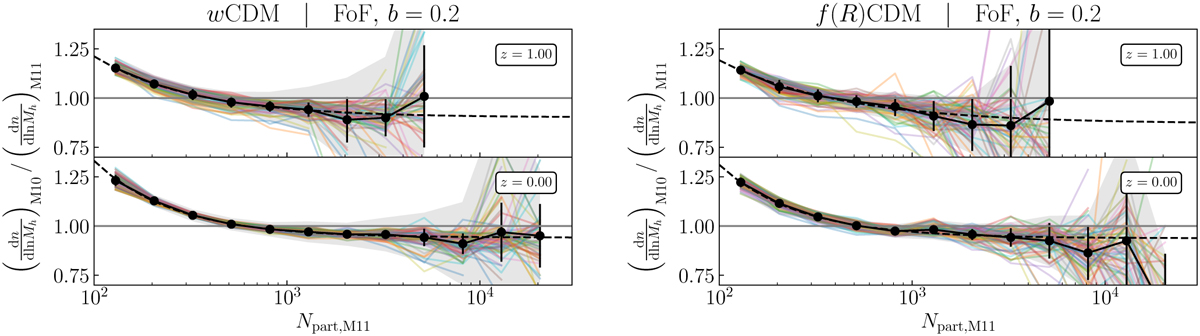
Download original image
Ratio of the FoF (b = 0.2) HMF with the better mass resolution M10 to the one with the standard mass resolution Mil as a function of the number of standard resolution particles per halo Npart,M11, in wCDM (left) and f(R)CDM (right), at z = 0 and z = 1. This quantity has been computed using the matching in terms of initial conditions between the L656_M11 and the L328_M10 simulation sets. Each coloured line corresponds to one of the 80 cosmological models of the emulator training set. The black solid line gives the mean over all cosmological models, with the standard deviation among them as error bars. The grey band attached to the mean is an estimation of the typical expected error for the individual HMF ratio. The dashed line corresponds to the fit to the mean using the fitting function given in Eq. (7).
Current usage metrics show cumulative count of Article Views (full-text article views including HTML views, PDF and ePub downloads, according to the available data) and Abstracts Views on Vision4Press platform.
Data correspond to usage on the plateform after 2015. The current usage metrics is available 48-96 hours after online publication and is updated daily on week days.
Initial download of the metrics may take a while.