Fig. 11
Download original image
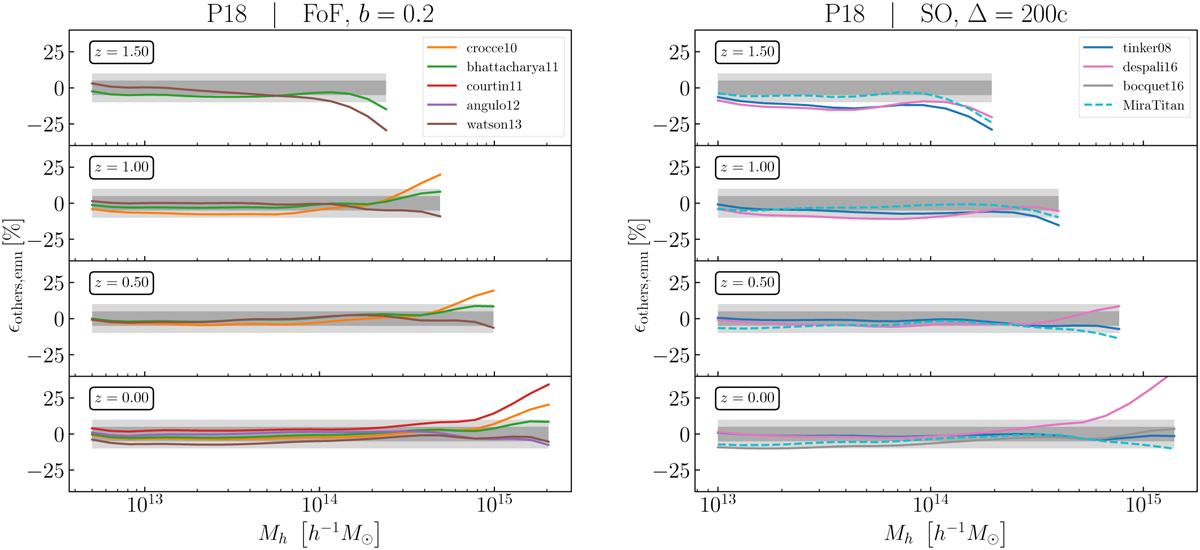
Relative difference between different HMF predictions from other works found in the literature and e-MANTIS, for the reference P18 cosmology and at different redshifts. Solid lines correspond to predictions from fits to simulations, and dashed lines to emulators. Left: FoF haloes with b = 0.2. Right: SO haloes with Δ = 200c. The light and dark shaded areas mark the ±5% and ±10% levels, respectively.
Current usage metrics show cumulative count of Article Views (full-text article views including HTML views, PDF and ePub downloads, according to the available data) and Abstracts Views on Vision4Press platform.
Data correspond to usage on the plateform after 2015. The current usage metrics is available 48-96 hours after online publication and is updated daily on week days.
Initial download of the metrics may take a while.