Fig. 4
Download original image
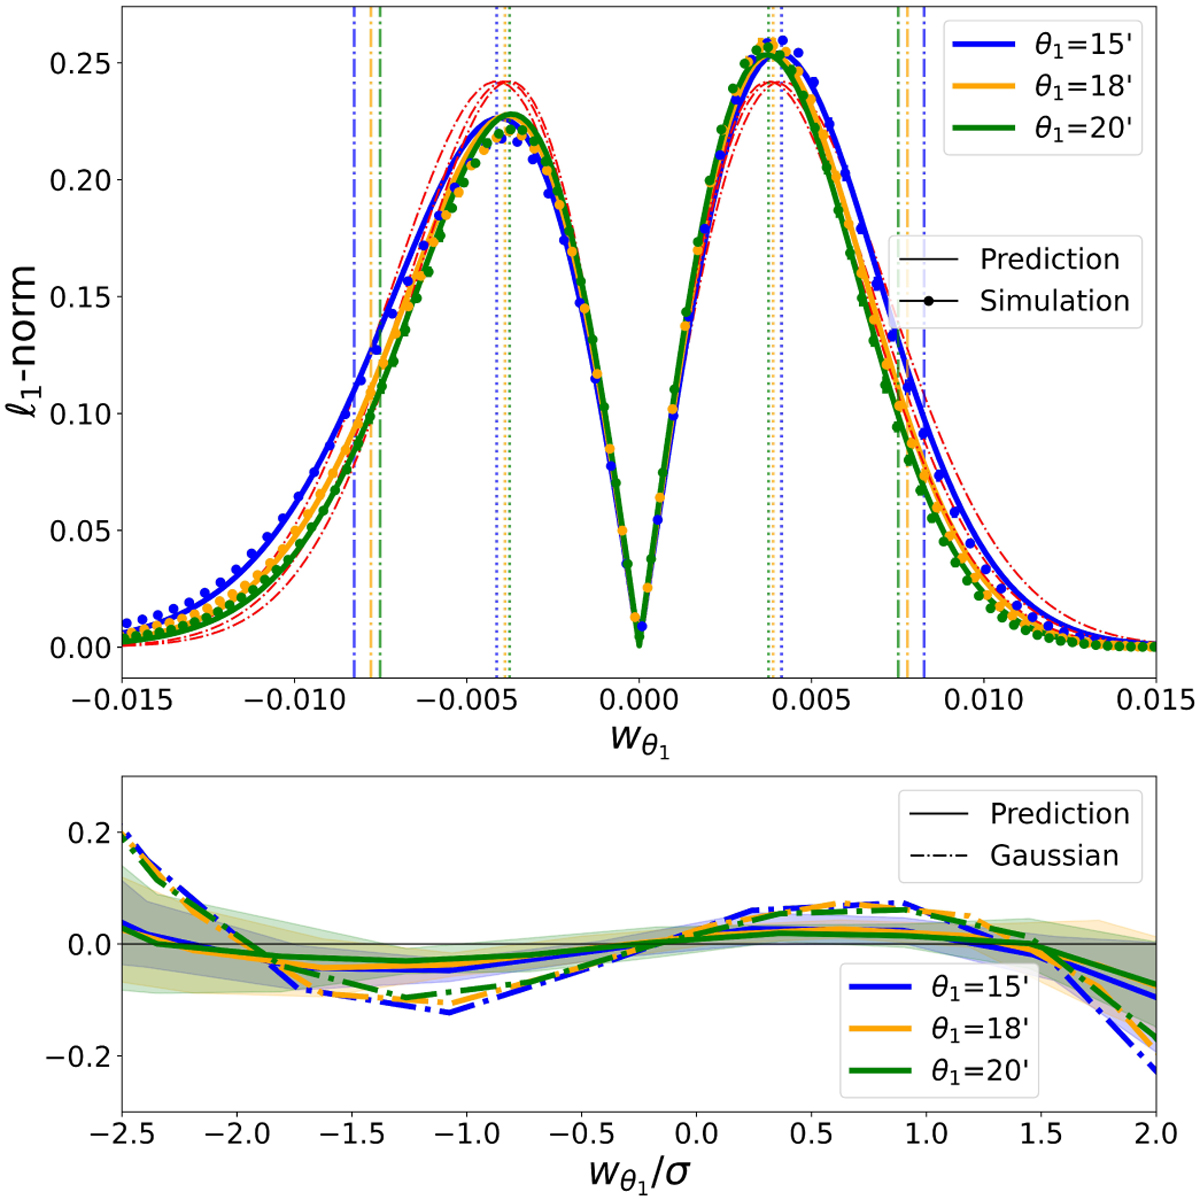
Comparison of the predicted wavelet ℓ1 -norm to the simulations at different scales. Top panel: predicted (solid) ℓ1 -norm as compared to measurements in simulation (dots) for different inner radii θ1 = 15′, 18′, and 20′ and a single source redshift zs = 1.43, displayed with blue, orange, and green lines, respectively. The dash-dotted red lines show the Gaussian prediction for reference. The vertical dotted and dot-dashed lines correspond to the 1σ and 2σ regions around the mean of the ![]() for each of the case considered. Bottom panel: residual of the prediction relative to the simulation (dotted lines). For reference, the dash-dotted plots illustrate the residual of the ℓ1 -norm derived from the Gaussian PDF with the same mean and variance as the simulation PDF. The shaded region indicates the 3σ region around the error bars for each inner radius. The prediction agrees well with the measurements up to approximately 2σ and remains within percent levels.
for each of the case considered. Bottom panel: residual of the prediction relative to the simulation (dotted lines). For reference, the dash-dotted plots illustrate the residual of the ℓ1 -norm derived from the Gaussian PDF with the same mean and variance as the simulation PDF. The shaded region indicates the 3σ region around the error bars for each inner radius. The prediction agrees well with the measurements up to approximately 2σ and remains within percent levels.
Current usage metrics show cumulative count of Article Views (full-text article views including HTML views, PDF and ePub downloads, according to the available data) and Abstracts Views on Vision4Press platform.
Data correspond to usage on the plateform after 2015. The current usage metrics is available 48-96 hours after online publication and is updated daily on week days.
Initial download of the metrics may take a while.