Fig. 1.
Download original image
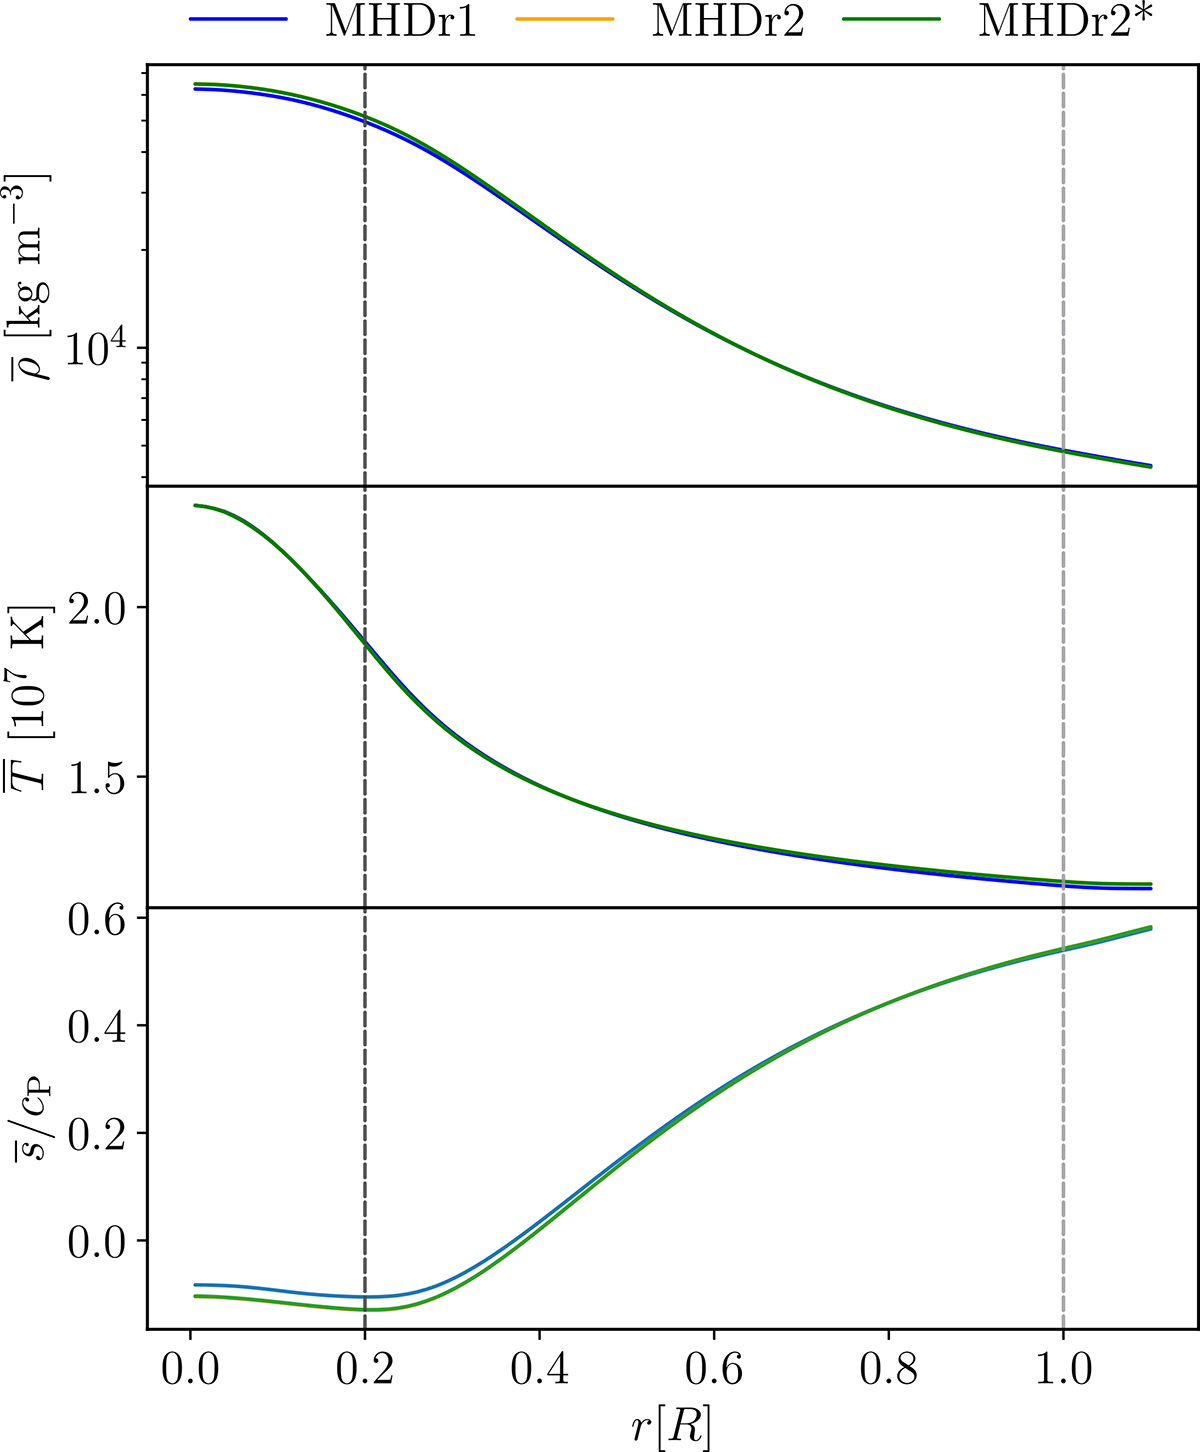
Density profiles as functions of radius from MHDr1, MHDr2, and MHDr2* (top). Temperature profiles for the same runs (middle). Specific entropy profiles from the same runs (bottom). The black dashed line indicates the surface of the convective core (r = 0.2R) and the grey dashed line the stellar surface (r = R). The quantities are time-averaged over the thermally relaxed phase.
Current usage metrics show cumulative count of Article Views (full-text article views including HTML views, PDF and ePub downloads, according to the available data) and Abstracts Views on Vision4Press platform.
Data correspond to usage on the plateform after 2015. The current usage metrics is available 48-96 hours after online publication and is updated daily on week days.
Initial download of the metrics may take a while.