| Issue |
A&A
Volume 691, November 2024
|
|
|---|---|---|
| Article Number | A289 | |
| Number of page(s) | 11 | |
| Section | Extragalactic astronomy | |
| DOI | https://doi.org/10.1051/0004-6361/202449673 | |
| Published online | 20 November 2024 | |
Central molecular zones in galaxies: 13CO(6–5) and molecular gas conditions in bright nearby galaxies
1
Sterrewacht Leiden, PO Box 9513 2300 RA Leiden, The Netherlands
2
Max-Planck-Institut für Radioastronomie, Auf dem Hügel 69, 53121 Bonn, Germany
3
Aix-Marseille Université, CNRS, LAM, Marseille 13388, France
⋆ Corresponding author; This email address is being protected from spambots. You need JavaScript enabled to view it.
Received:
20
February
2024
Accepted:
22
August
2024
Abstract
This paper summarizes all presently available Jupp ≥ 5 13CO and accompanying 12CO measurements of galaxy centers including new J = 6–5 13CO and 12CO observations of eleven galaxies with the Atacama Pathfinder EXperiment (APEX) telescope and also Herschel high-J measurements of both species in five galaxies. The observed J = 6–5/J = 1–0 12CO integrated temperature ratios range from 0.10 to 0.45 in matching beams. Multi-aperture data indicate that the emission of 13CO(6–5) is more centrally concentrated than that of 12CO(6–5). The intensities of 12CO(6–5) suggest a correlation with those of HCO+ but not with those of HCN. The new data are essential in refining and constraining the parameters of the observed galaxy center molecular gas in a simple two-phase model to approximate its complex multi-phase structure. In all galaxies except the Seyfert galaxy NGC 1068, high-J emission from the center is dominated by a dense (n ∼ 105 cm−3) and relatively cool (20–60 K) high-pressure gas. In contrast, the low-J lines are dominated by low-pressure gas of a moderate density (n ∼ 103 cm−3) and more elevated temperature (60–150 K) in most galaxies. The three exceptions with significant high-pressure gas contributions to the low-J emission are all associated with active central star formation.
Key words: ISM: molecules / galaxies: ISM / galaxies: nuclei
© The Authors 2024
 Open Access article, published by EDP Sciences, under the terms of the Creative Commons Attribution License (https://creativecommons.org/licenses/by/4.0), which permits unrestricted use, distribution, and reproduction in any medium, provided the original work is properly cited.
This article is published in open access under the Subscribe to Open model. This email address is being protected from spambots. You need JavaScript enabled to view it. to support open access publication.
1. Introduction
Late-type galaxies frequently contain conspicuous central concentrations of molecular gas. These may play an important role in galaxy evolution when they serve as the reservoirs that feed super-massive black holes, circumnuclear star formation, and massive gas outflows. Various 12CO ladder surveys, in particular those conducted with the Herschel Space Observatory, unambiguously point to the simultaneous presence of both low-pressure and high-pressure gas in these reservoirs (Mashian et al. 2015; Kamenetzky et al. 2016, 2017; Lu et al. 2017; Crocker et al. 2019), requiring a multi-phase analysis.
Table 1 illustrates how different molecular line transitions, in principle, can be used to determine molecular gas temperatures and densities. The values in that table were, however, calculated ignoring radiative trapping and assuming optically thin emission, whereas the 12CO, HCN, and HCO+ transitions are optically thick. Significant emission occurs well below the critical density, at densities lower by one or two orders of magnitude (cf. Shirley 2015). Nevertheless, the table provides useful upper limits to the temperature and the density that can be deduced from a transition-limited survey. For instance, 12CO J = 2–1/J = 1–0 intensity ratios distinguish kinetic temperatures increasingly poorly above 20 K, and 12CO ladders up to J = 4–3 fail to make meaningful distinctions between temperatures above 100 K.
Line excitation.
A complication is the degeneracy of optically thick 12CO ladders with respect to the kinetic temperature, volume density and column density (hence mass) of the gas. A striking illustration of their failure to differentiate between even the very different environmental conditions in NGC 6240 and Mrk 231 is provided by Meijerink et al. (2013). Likewise, Weiss et al. (2007) found equally good fits to the 12CO ladders of luminous galaxies but they could not resolve the temperature-density ambiguity. Additional information preferably in the form of optically thin emission from species such as 13CO is required to alleviate the degeneracy (Bayet et al. 2006; Israel 2020, hereafter Paper I). Depending on the available data, two or three gas phases can be modeled. For most purposes, a two-phase analysis suffices as it can be made to fit most of the available observations (e.g., the cases of M 82 and NGC 253 discussed by Loenen et al. 2010 and by Rosenberg et al. 2014).
The presently available data on galaxy centers do not constrain the relative amounts of low-pressure and high-pressure gas equally well. In Paper I, we presented a systematical probe of the physical condition of the molecular gas with ground-based surveys of both 12CO and 13CO in transitions up to Jupper = 4 and found densities between 102 cm−3 and ≥104 cm−3 and temperatures ranging from ∼30 K to ≥100 K. The elevated gas temperatures, increased turbulence, and higher metallicities that characterize galaxy centers cause a systematic overestimate of the molecular hydrogen amounts by traditional methods. Instead, the so-called X-factor relating CO intensities to H2 column densities is an order of magnitude lower than the “standard” value in galaxy centers, including the Milky Way center.
These low-J transitions are particularly sensitive to molecular gas of a modest density (cf. Table 1) and constrain the column density and mass of the low-pressure gas relatively well, even though the available line intensities usually do not fully constrain even a two-phase model. In particular, they do not adequately sample the temperatures and densities at the high-pressure end which are much more sensitive to feedback from active-galaxy nuclei (AGN) and from starburst activity. This requires additional surveys of the higher-J 12CO transitions such as those provided by the Herschel Spectral and Photometric Imaging Receiver (SPIRE) and Photoconductor Array Camera and Spectrometer (PACS) that cover 12CO transitions Jupp ≥ 4 in a large number of galaxies (e.g., Mashian et al. 2015; Rosenberg et al. 2015; Kamenetzky et al. 2016). Such observations were attempted with the Herschel Heterodyne Instrument for the Far-Infrared (HIFI) overlapping the few cases where SPIRE sensitivities did also allow the determination of 13CO line fluxes.
High-frequency observations of extragalactic 13CO lines are also feasible with ground-based equipment but only at the high-elevation facilities in Hawaii and the Chilean Andes. High atmospheric opacities prevent ground based observation of the J = 4–3 and J = 5–4 13CO transitions. The 13CO line intensities, already low in almost all galaxies, further decrease with increasing J level. This leaves the J = 6–5 13CO line as the most practical choice to sample the high-excitation gas in galaxy centers from the ground.
2. Galaxy sample
The sample considered here includes the few galaxies with Herschel detections of 13CO in Jupp ≥ 5 transitions. These concern fluxes extracted from SPIRE spectra covering a great spectral range with low spectral resolution and from targeted Heterodyne Instrument for the Far-Infrared (HIFI) observations with much higher spectral resolution resolving the line profiles. Although SPIRE detected many galaxies in various 12CO transitions, the weak 13CO lines were unambiguously detected only in the brightest galaxies on the celestial sky mostly in guaranteed observing time.
The 12CO(6–5) line was readily observed from the ground, first in the bright galaxies accessible from Hawaii, notably M 82, NGC 253, and IC 342 (Harris et al. 1991; Ward et al. 2003; Seaquist et al. 2006) and in some red-shifted luminous galaxies from lower-elevation sites (cf. Weiss et al. 2007). Less luminous closer galaxies followed (e.g., Bayet et al. 2004, 2006), but the ground-based detection of the 13CO(6–5) line in NGC 253 (Hailey-Dunsheath et al. 2008) so far stood alone. The development of sensitive high-frequency receivers for use in the southern hemisphere provided the opportunity to change this situation. Inspection of the J = 6–5 12CO data in the Herschel archive yielded a limited number of galaxies bright enough to attempt J = 6–5 13CO detection from the southern hemisphere without the need for prohibitively long integration times. The sample selected for new observations is listed in Table 2. It includes six galaxies with starburst centers, three have AGN centers, one is the Luminous InfraRed Galaxy merger (LIRG) NGC 6240, and one has a mixed AGN-starburst center (NGC 1365). The two northern galaxies bright enough to have literature mid-J 13CO intensities (M 82 and IC 342) have been included for completeness sake.
Sample galaxies.
3. Observations
The observations are part of two separate programs with the Atacama Pathfinder EXperiment telescope (APEX; Güsten et al. 2006) at the Llano de Chajnantor high-elevation site in the Chilean Andes. The first series of observations was carried out with the Carbon Heterodyne Array of the MPIfR (CHAMP+) receiver in guaranteed observing time between 2008 and 2012 (projects X-081.F-1002-2008, E-085.B-0094B-2010, E-088.B-0075A.2011, and X-089.F-0007-2012). The second series of observations was carried out with the Swedish-ESO PI instrument for APEX (SEPIA) receiver in 2019 guaranteed observing time and in 2021 regular European southern observatory (ESO) time (projects E-0104.B-0034A-2019 and E-0108.C-0586A.2021). At the observing frequencies of 661.067 GHz ( 13CO(6–5)), 691.473 GHz ( 12CO(6–5)) and 806.651/809.350 GHz ( 12CO(7–6)/ [C I](2–1)) the APEX full-width half maximum (FWHM) beam sizes are 9.3″, 8.9″ and 7.7″ according to the on-line data sheets. Calibration scans on Jupiter and Mars yield efficiencies needed to transform antenna temperatures  into main beam temperatures Tmb of effectively ηmb = 0.48, 0.52, and 0.48 with uncertainties of 0.021. The conversion factor S/Tmb of flux density S to brightness temperature Tmb) is about 60 Jy/K. The observed line profiles are shown in Fig. 1.
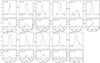 |
Fig. 1. Observed J = 6–5 12CO (top) and J = (6–5) 13CO (bottom ) profiles of galaxy centers. Horizontal scale velocity (VLSR in km s−1, vertical scale observed antenna temperature TA*. Note the overall weakness of 13CO lines. |
3.1. CHAMP+ observations
CHAMP+ is a dual-band 2 × 7 element heterodyne array developed by the Max Planck Institute für Radioastronomie (MPIfR) in Bonn (D), the Stichting RuimteOnderzoek Nederland (SRON) in Groningen (NL), and the Jet Propulsion Laboratory (JPL) in Pasadena (USA). It is a principal investigator (PI) instrument operated for the APEX community as a collaborative effort with MPIfR (Kasemann et al. 2006; Güsten et al. 2008). The array can be operated simultaneously in ALMA (Atacama large millimeter/submillimeter array) bands 9 and 10, and we used this property to obtain carbon J = 2–1 [C I] (rest frequency 809 GHz) and J = 7–6 12CO (rest frequency 806 GHz) measurements simultaneously with the Band 9 J = 6–5 12CO and 13CO line measurements. Both sub-arrays have closely spaced pixels in a hexagonal arrangement providing data sampling with half-beam spacing in scanning mode. The backend is an autocorrelator array with a total bandwidth of 32 GHz and 32 768 spectral channels, subdivided into 32 IF bands of 1 GHz and 1024 channels each. We used position-switching with a throw of 900″, well clear of the galaxy main bodies. On-the-fly maps were obtained for all sources, mostly with 50″ × 50″ field-of-views. For the purposes of this paper, we extracted single emission profiles by spatially binning all emission within an area corresponding to the desired resolution. The Band 9 data were obtained with sky conditions varying from good (total system temperature including sky Tsys = 840 K) to just acceptable (Tsys = 1675 K). In Band 10, total system temperatures varied from 2400 to 4000 K. The calibration is estimated to be accurate to ≤30%. This error is almost entirely governed by baseline uncertainties. The emission from the observed galaxies typically occupies about half of the 1200 km s−1 window covered by the backend and leaves limited room for accurate baseline definition. The baseline errors are too large to derive reliable fluxes for the weak 13CO emission.
3.2. SEPIA observations
The (SEPIA) is a single-pixel heterodyne receiver with a cryostat accommodating three ALMA-like receiver cartridges (Belitsky et al. 2018), provided by the group for advanced receiver development (GARD) at the Onsala space observatory (S). We used the SEPIA660 cartridge (Baryshev et al. 2015), which is a dual polarization 2SB receiver installed and commissioned by the Groningen NOVA group (NL) during the second half of 2018. The SEPIA660 receiver covers the window between 597 GHz and 725 GHz. It has two IF outputs per polarization, USB and LSB, each covering 4–12 GHz, adding up a total of 32 GHz instantaneous IF bandwidth. The central frequencies of the two side-bands are separated by 16 GHz. The backend was an FFT spectrometer with a spectral resolution of about 61 kHz (26 m/s) with 65 536 channels per every 4 GHz. For NGC 253 and NGC 4945 we obtained a five-point cross on the central position in 12CO; all other observations were single pointings. The sky conditions mostly varied from very good (Tsys = 500 − 700 K) to good (Tsys = 700 − 1100 K). Throughout the observations, the baselines were quite stable and the (much) wider velocity coverage allowed good baseline definition and subtraction.
3.3. Additional observations
In the following discussion, we also include the mid-J 13CO observations of bright galaxies that already exist in the literature. These concern spaceborne and ground-based detections of NGC 253 (Hailey-Dunsheath et al. 2008; Pérez-Beaupuits et al. 2018), IC 342 (Rigopoulou et al. 2013), NGC 3034 (M 82; Loenen et al. 2010; Panuzzo et al. 2010; Kamenetzky et al. 2012), NGC 5128 (Centaurus A; Israel et al. 2014) and NGC 4945 (Bellocchi et al. 2020).
4. Results and analysis
4.1. Extracted 12CO line intensities
The velocity-integrated and peak J = 6–5 12CO and 13CO line intensities measured with the CHAMP+ and SEPIA660 receivers are listed in Table 3. The table also lists the J = 7–6 12CO and J = 2–1 [C I] fluxes measured with the CHAMP+ receiver in parallel with the J = 6–5 observations. To facilitate comparison, we have binned these higher frequency data to the somewhat lower spatial resolution of the J = 6–5 measurements. The errors listed are stochastic errors; they do not include systematic errors due to calibration etc. For NGC 1365 and NGC 1808 12CO intensities were available from both the CHAMP+ and the SEPIA660 receiver on APEX. Comparison shows a good agreement between the results obtained with the different receivers on different occasions. In spite of the different observing techniques, there is likewise good agreement, for the three galaxies observed with Herschel/SPIRE that were also mapped with APEX/CHAMP+. In comparable apertures, the CHAMP+ fluxes are 20 per cent higher for both NGC 1068 and NGC 1097 and 20 per cent lower for NGC 1365. The galaxies NGC 660 and NGC 1808 were not observed with SPIRE.
Results of APEX observations.
Five of the sample galaxies are relatively close to our Galaxy with distances D = 3.4–4.5 Mpc (Table 2). At microwave frequencies, they are among the brightest galaxies in the sky. Three of them (NGC 253, M 82, and NGC 4945) accordingly have 12CO(6–5) intensites an order of magnitude higher than the other galaxies in the survey, including those at the same distance (IC 342 and M 83). The remaining eight galaxies have 12CO intensities similar to the latter although they are at three to five times greater distance, thirty times greater in the case of the ultra-luminous galaxy NGC 6240. A similar pattern applies to the considerably weaker 13CO(6–5) fluxes that required integration times up to several hours.
In ten of the thirteen galaxies of the sample, 12CO(6–5) intensities were measured at different spatial resolutions. They either have multiple pointed observations in the different SEPIA660, HIFI and SPIRE apertures, or they were mapped, for instance with the CHAMP+ receiver, which allowed extraction of intensities binned to various resolutions θ. The results for individual galaxies are shown in Fig. 2 together with fits to the data of the form log(Tmbdv) = a log(θ) + b. In this formulation, a = 0 corresponds to an extended source of constant surface brightness and a = −2 corresponds to a point source. Intensities at the various resolutions in the narrow range −0.75 ≥ a ≥ −1.2 (9″–43″) are listed in Table 4 together with the fit coefficients a (slope) and b (intercept). The nearly edge-on galaxy NGC 3034 (M 82) has a flat slope a = −0.56 caused by a relative lack of 12CO(6–5) emission from the center (see Seaquist et al. 2006; Loenen et al. 2010) but the remainder has an average slope a = −0.92. A similar inverse proportionality between intensity and aperture in the central regions of galaxies was also found, with larger dispersion, for low-J emission from the 12CO molecule (Paper I) as well the HCN and HCO+ molecules that trace molecular gas with critical densities similar to those of the 12CO(6–5) transition (Israel 2023, hereafter Paper II). Such behavior is characteristic for the centrally peaked emission from galaxies illustrated in Figure 3 of Paper I. No dependence on distance is apparent. The average a = –0.9 of the nearby galaxies NGC 253, NGC 3034, NGC 4945, and NGC 5236 only samples the central 0.7–0.9 kpc. The intensities of the more distant galaxies (except NGC 6240) sample the significantly larger inner regions with diameters of 2.6–4.5 kpc, yet have the same average a = –0.9.
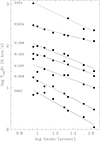 |
Fig. 2. Integrated 12CO(6–5) line intensities as a function of aperture. For clarity sake, points for NGC 1808 and NGC 660 were shifted down by 0.80 and 0.85, respectively. Solid lines are least-squares fits to the data. Six galaxies have poor data coverage and are not shown. NGC 613, IC 342, and NGC 2559 have a single data point each. NGC 4945, NGC 5236, and NGC 6240 have only two data points each. |
Beam-dependent 12CO(6–5) intensities.
4.2. J = 6–5 12CO/ 13CO intensity ratios
The APEX survey provides direct determination of the J = 6–5 12CO/13CO intensity ratio at a resolution of 9″ in the eleven galaxies listed in Table 5. The table includes the corresponding J = 3–2, J = 2–1, and J = 1–0 ratios in apertures covering surface areas larger by factors of 2.4, 15, and 6.0, respectively (Paper I). The J = 1–0 to J = 3–2 intensity ratios are typically 10–15 in all galaxies except NGC 6240. In seven galaxies the J = 6–5 and J = 1–0 ratios do not significantly differ. In the other galaxies, the J = 6–5 ratio exceeds the J = 1–0 ratio by a factor of up to two. Four galaxies have relatively high J = 6–5 ratios 20. The intensity ratios of the LIRG NGC 6240 are the highest in the sample. Papadopoulos et al. (2014) suggest even higher ratios for this galaxy. These and other literature ratios have, however, large uncertainties because the very weak and broad 13CO lines are highly sensitive to baseline errors. Measurements with Herschel provide additional J = 5–4 to J = 8–7 intensity ratios for five more galaxies at the substantially lower resolutions of 33″–43″ listed in Table 6, thereby sampling surface areas twelve to twenty times larger than covered by the APEX beam. The large-aperture 12CO/ 13CO intensity ratios in the Jupp ≥ 6 transitions in Table 6 are two to three times higher. The J = 5–4 intensity ratio is transitional, with an in-between average of ∼16. The large-area HerschelJ = 6–5 ratios vary little, ranging between 22 and 26, and are similar to the four highest J = 6–5 ratios in the APEX sample. For NGC 253 and NGC 4945, J = 6–5 ratios are available in both apertures. In the fifteen times larger surface area sampled by Herschel, the J = 6–5 isotopologue ratio has increased from the APEX value ∼13 to the almost twice higher value of 23. In these two galaxies, the 13CO intensities are thus much weaker beyond the inner 200 pc and even more centrally peaked than the 12CO intensities. At least half (six out of thirteen) of the galaxies surveyed exhibits Jupp ≥ 6 intensity ratios of 20–30 in either small or large apertures. By analogy, this could also be the case for the other galaxies in Table 5 lacking Herschel 13CO data.
APEX 12CO/ 13CO isotopologue intensity ratios.
We can take this a step further for NGC 253 and NGC 4945. After subtraction of the contribution by the inner circumnuclear area (APEX) to the larger central area (Herschel), the intensity ratio in the residual 9″–33″ zone of either galaxy becomes 12CO(6 − 5)/ 13CO(6 − 5)∼40, suggesting low optical depths also for 12CO. Together with ratios in excess of 20–30 in transitions with Jupp ≥ 6 this is consistent with intrinsic [12CO]/[13CO] isotopologue abundances of about 40 (cf. Tang et al. 2019; Viti et al. 2020), as assumed in our earlier Papers I and II on circumnuclear molecular gas.
4.3. Further line ratio comparisons
In these papers, we adopted a “standard” aperture of 22″ for intercomparison of the observed line intensities. For the galaxy centers in this paper, we obtained such normalized 12CO(6–5) intensities in a 22″ aperture either by direct determination or interpolation from Table 4, or by extrapolating the observed 9″ intensities from Table 3 with the average slope a = –0.9 just determined (NGC 613, IC 342, and NGC 2559). These are directly comparable to the 22″ Jupp ≤ 4 line intensities (Paper I) of the same galaxies. In Fig. 3 (top) we show relations between 12CO line ratios constructed from these data. We also plotted transition intensity ratios in the 43″ apertures of a larger sample of twenty galaxies using the 12CO intensities compiled by Kamenetzky et al. (2016) and Paper I. Nine galaxies are common to both samples. For comparison we added the nearby starburst dwarf galaxy He2-10 (data from Bayet et al. 2006) as well as both the inner Milky Way and the Galactic Center (data from Fixsen et al. 1999).
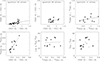 |
Fig. 3. Comparison of observed line ratios. Straight lines mark least-squares linear fits to the data displayed. Top row: comparison of J = 6–5 and J = 3–2 line intensities normalized by J = 1–0 intensity. Left: 12CO ratios in 43″ apertures. Open circle marks the Inner Galaxy including Galactic Nucleus. Center: 12CO ratios in 22″ apertures. Open circle marks the Galactic Center; open square marks the starburst dwarf galaxy He2-10. In both panels, the relatively nearby galaxies at distances D ≤ 6.5 Mpc are marked by a cross. Right: 13CO ratios in extrapolated 11″ apertures. Bottom row: comparison of isotopologue intensities in (extrapolated) 11″ apertures. Left: comparison of the 13CO and 12CO J = 6–5/J = 1–0 intensity ratios. Center: comparison of the J = 6-5 isotopologue intensity ratios and the 13CO J = 6–5/J = 1–0 intensity ratios. The outlier NGC 6240 is not included. Right: isotopologue intensity ratios as a function of 12CO(6–5)/ 12CO(1–0) intensity ratios. The J = 1–0 isotopological ratios are assumed to be identical in 11″ and 22″ apertures. Filled circles mark isotopological intensity ratios in the J = 6–5 transition, open circles those in the J = 1–0 transition. |
As noted in Sect. 4.2, comparison of the data in Tables 5 and 6 suggests a strong aperture-dependency of the 12CO/ 13CO ratio.
Herschel 12CO/13CO isotopologue intensity ratios.
The 13CO(6–5) intensities are not so easily normalized to a 22″ aperture because only a single point per galaxy is observed at a resolution of 9.5″. In order to minimize aperture-dependent effects we have limited the extrapolation to an aperture of 11″ and we assumed identical distributions for the emission in the 13CO and 12CO lines over this small range. If instead the 13CO(6–5) emission is point-like, its normalized intensity is overestimated by ∼15%. For the normalization of the 13CO(1–0) intensity we assumed instead emission aperture ratios identical to those in the J = 2–1 transition (Israel 2020). In a similar way we extrapolated the 13CO(3–2) data over the small range of 14″–11″. In Figure 3 (bottom) we show the relations of the isotopologues to each other and to the J = 6–5 and J = 1–0 transitions.
4.4. Excitation of the 12CO(6–5) gas
Studies of the 12CO rotational ladders of galaxy centers have been published by several authors (Bayet et al. 2006; Weiss et al. 2007; Greve et al. 2014; Rosenberg et al. 2015; Mashian et al. 2015, and Kamenetzky et al. 2016) to which we refer for further detail. In these studies, the rotational ladders are primarily interpreted in terms of excitation and the heating and cooling balance of the gas. The SPIRE and PACS 12CO ladders (Rosenberg et al. 2015; Mashian et al. 2015) illustrate the great variety in overall shape. This variety is already apparent in the line intensity ratios shown in the top left and center panels of Fig. 3. The excitation represented by the (6–5)/(1–0) and the (3–2)/(1–0) 12CO ratios varies for the galaxies in our sample in a manner not related to galaxy type. The excitation of the emission in these transitions increases significantly with decreasing aperture size. The trend is continued when 13CO line intensity ratios observed at even higher resolution are plotted (Fig. 3 top right). The two ratios are weakly correlated (slope a = 0.17 ± 0.09). The systematic displacements imply that the excitation of the central molecular gas increases towards the galaxy nucleus.
The panels in the bottom row of Fig. 3 show the relations of the isotopological 12CO and 13CO intensities to each other and to the J = 6–5/J = 1–0 transitions ratios. Although the LIRG NGC 6240 was observed, we exclude it from most of the following analysis as its extreme distance, surface area measured, and luminosity class (see e.g., Greve et al. 2009; Papadopoulos et al. 2014) set it too far apart from the other galaxies in the sample. For the other galaxies, there is a clear relation between the 13CO and 12CO ladders (bottom left panel) but the intensity ratio of the (6–5) and (1–0) transitions increases more rapidly for the optically thin 13CO than for the optically thick 12CO. On the other hand, the J = 6–5 12CO/ 13CO isotopological intensity ratio is not correlated with the intensity ratio of the J = 6–5 and J = 1–0 13CO or 12CO transition that track the gas excitation nor is the J = 1–0 12CO/ 13CO isotopological intensity ratio (bottom center and bottom right panels).
The critical density of 12CO(6–5) is similar to that of HCN(1–0) and falls in between those of HCO+(1–0) and HCO+(3–2), (see Table 1, so that a mutual comparison may be of interest. Again, we normalize all line intensities by the 12CO(1–0) intensity. Fig. 4 explores the behavior of J = 6–5 12CO and 13CO lines as a function of the HCN(1–0), HCO+(1–0) and HCO+(3–2) intensities (data from this paper and from Papers I and II). In all panels, the most extreme (6–5)/(3–2) 12CO ratios belong to NGC 6240 (high) and NGC 5055 (low). No correlation is apparent between the HCN(1–0) and either 12CO(6–5) or 13CO(6–5) line intensities (Fig. 4, leftmost panels) or HNC(1–0) (not shown) despite their very similar critical densities. There is, perhaps, a correlation between the 12CO(6–5) and HCO+(1–0) line emission (top center panel) and, more convincingly in spite of the few data points available, between HCO+(3–2) and 12CO(6–5) and even 13CO(6–5) (rightmost top and bottom panels). This suggests that HCO+ is linked to the excitation of high-J 12CO and 13CO (but see also Papadopoulos et al. 2010) and HCN is not. This is consistent with the poor sensitivity of the HCN/CO intensity ratios to both column density and fraction of dense gas noted by Priestley et al. (2024) in molecular cloud simulations and by Israel (2023) in extragalactic multi-transition molecular line surveys. Although the heating and cooling of extragalactic molecular gas can be determined from the observed 12CO ladders, this is not so easily the case for its physical parameters temperature, density, column density as these are highly degenerate. Single-gas-phase models in general do not adequately explain even relatively uncomplicated extragalactic 12CO ladders and models with two or more distinct gas components are needed (e.g., Greve et al. 2014; Mashian et al. 2015; Kamenetzky et al. 2016). This need had already been recognized in the analysis of multiple low-J transitions of optically thick 12CO complemented by optically thin 13CO transitions (for instance Israel & Baas 2001; Israel 2005; Bayet et al. 2006).
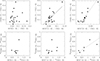 |
Fig. 4. Top: 12CO (6–5)/(1–0) intensity ratios as a function of HCN(1–0), HCO+ and HCO+(3–2) line intensities relative to 12CO(1–0). All ratios refer to a resolution of 22″, except the 13CO (6–5)/(1–0) ratios that refer to extrapolated 11″ apertures (cf. Sect. 4.3). The central and rightmost panels include linear fits to the data. Bottom: the same as the top row, but with 13CO lines substituted for 12CO lines. The dashed line in the rightmost panel is an eyeball fit to the limited data. |
5. Molecular gas physics revealed by J = 6–5 CO lines
The objects in this paper were all included in the previously published survey of the J = 1–0, J = 2–1, J = 3–2 transitions of 12CO and 13CO emission from galaxy centers whereas for half the sample the J = 4–3 12CO transition was also measured (Paper I). The results of that survey were evaluated with large-velocity-gradient (LVG) models employing the RADEX radiative transfer code (van der Tak et al. 2007). For the details of the analysis we refer to section 5 of Paper I. The LVG approximation efficiently solves the radiative transfer equation in non-LTE environments and yields a first order determination of the gas properties in a homogeneous medium. For each case, the model provides an average description of all the molecular gas in the aperture, thus lumping together gas of all temperatures and densities. As the number of gas phases included is increased, the models become ever more realistic. The RADEX analysis, however, requires four input parameters per phase and per species (H2 kinetic temperature and density, molecular column density per velocity interval, relative molecular abundance). Even with simplifying assumptions (such as identical H2 temperature and density for all species), the number of phases that can be simultaneously modeled is severely limited by the number of independent measurements. In the case of the low-J 12CO and 13CO measurements presented in our previous work only two gas-phases can be modeled. This allows a first, coarse separation of the dominant gas components, such as dense or diffuse, and cool or warm. Although a simplification of reality, this is nevertheless already a great improvement on single-phase models that produce averages with little physical meaning. A complication is that for each gas phase, the observed line intensities are always subject to degeneracies between temperature, density, and column density per velocity interval. These degeneracies are not always clearly resolved by the limited number of transitions providing independent line intensities especially when finite errors are taken into account. Instead of a well-constrained unique result, the two-phase modeling produced for each galaxy a number of possible solutions. These form a well-defined and limited range of physical parameters; examples are given in Appendix C.1 of Paper I. With only low-J transitions, the number of independent measurements is usually sufficient only to marginally constrain the seven parameters needed to describe two phases, producing tight constraints for some parameters but leaving others practically unconstrained. Fits with a cut-off at the J = 3–2 or J = 4–3 transitions tend to underestimate the parameters of the high-pressure gas, in particular the density. Biased fit results for the high-pressure gas in turn influence the fit parameters of the low-pressure gas, especially the temperature.
This is borne out by the new measurements in the J = 6–5 transition. For each galaxy the various physical parameter sets that provide good fits to the Jupp ≤ 3 intensity ratios, including the “best” fits listed in Table C.2 of Paper I, fail to adequately predict the line intensities observed in the J = 6–5 transition. The observed 12CO intensities generally exceed the model-predicted values by factors of two or more.
For 13CO(6–5), the result is no better. Even in galaxies where the predicted 22″ model isotopologue intensity ratios are broadly similar to the observed 9″ APEX ratios this is only because the individual 12CO and 13CO intensities are both off by the same factor. Thus, the observations of the lower J = 1–0, J = 2–1, and J = 3–2 transitions alone do not sufficiently constrain the modeling of gas physical parameters to also allow successful prediction of the higher J = 6–5 transition intensities. The new J = 6–5 12CO and especially 13CO observations provide information on the physical condition of the molecular gas not apparent in the lower-J measurements.
This has major consequences for the modeling presented in Paper I. The addition of two more intensities increases the number of independent parameters to the number required to fully describe the two gas phases. The number of possible parameter sets derived from the Jupp ≤ 3 analysis for each galaxy is drastically reduced. To agree with the Jupp = 6 data, at least one of the two model phases needs to have a kinetic temperature of 60 K or higher, and at least one of the two phases needs to have a density of 104 cm−3 or higher. Sets falling short of this criterion can be removed – this includes all but a few of the sets that were earlier found to provide possible solutions in in the analysis described in Paper I. The Jupp ≤ 3 measurements very poorly distinguish temperatures and densities much above these values (cf. the effective upper limits in Table 1). High model temperatures and (column) densities from the initial analysis need fine-tuning to fit the J = 6–5 values without compromising the low-J line ratios.
Still assuming a [12CO]/[13CO] isotopic abundance ratio of 40 (Tang et al. 2019; Viti et al. 2020), we revised the two-phase models of the sample galaxies from Paper I to accomodate the new J = 6–5 intensities. The newly determined parameters of the two phases are summarized in Columns 2, 3 and 4 of Table 7. For each galaxy, two entries are given that refer to the respective high-pressure (top) and the low-pressure phase (bottom) identified in Column 5. Columns 6–8 list the fractions of the total 12CO(1–0) and 12CO(6–5) emission and the mass associated with each gas phase. Finally, Columns 9–11 show the J = 6–5 12CO and 13CO model line ratios for the combined emission from the two phases. These can be compared to the observed (6–5)/(1–0) ratios listed in Table 3 and the isotopologue intensity ratios in Tables 5 and 6. We did not remodel NGC 6240 as it is incomparable to the other galaxies in terms of distance, area covered, and luminosity class (see e.g., Greve et al. 2009; Papadopoulos et al. 2014).
Physical parameters from molecular gas modeling.
The inclusion of the J = 6–5 measurements thus results in fits that are much more tightly constrained than those based on the Jupp ≤ 4 transitions only. This is largely due to the 13CO intensities that render the isotopological intensity ratios particularly sensitive to changes in the physical parameters. Most of the solutions allowed by the analysis in Paper I are completely ruled out by the present analysis. There remains a small residual uncertainty due to the limited ability to distinguish between temperatures above 200 K and densities well in excess of 105 cm−3.
For two-phase models, much of the ambiguity previously present is eliminated. Other parameter combinations are still possible but only as long as they are close to those listed in Table 7. It is, however, unfeasible to assign uncertainties to individual parameters because of the trade-offs inherent in degeneracies. Instead, we assign very roughly a factor of two uncertainty to the overall result. An additional source of uncertainty is the actual 12CO/ 13CO abundance. Values as low as 30 and as high as 70 have been published but most determinations settle around 40 which is the value we assumed. If in any galaxy the abundance is different, this would lead to modestly different model parameters. We note that such a situation seems to apply to luminous infrared galaxies such as NGC 6240 with abundances of 100–200.
The two-phase model fits presented here provides a simplified but robust picture of the molecular gas in the sample galaxies, especially as concerns the division in gas of high and of low pressure. They are, however, still a first approximation and not yet a fully realistic description of that gas. Nevertheless, the agreement with similar results derived independently by others is encouraging. From the analysis of CS emission ladders in half a dozen galaxies Bayet et al. (2009), for instance, conclude to the general presence of two high-pressure phases with kinetic temperatures all below 70 K, with similar densities 0.4–1.6 × 105 cm−3 for the dominant cold high-pressure phase but with higher densities 2.5–40 × 105 cm−3 for the more sparse warm high-pressure phase. The galaxy NGC 253 also provides an interesting case for comparison, because it has been comprehensively analyzed by Rosenberg et al. (2014) and Pérez-Beaupuits et al. (2018), using all available 12CO, 13CO, HCN, [C I], and [C II] lines to fit three distinct gas components. The results listed for the phases of NGC 253 in Table 7 are within a factor of two of the results for the corresponding phases in these two analyses.
Compared to our earlier analysis by Paper I, the new results in Table 7 show either similar or moderately higher temperatures and densities for the low-pressure gas forced by the new high-pressure values. The high-pressure gas temperatures are also roughly similar but the densities are revised up, in most cases significantly, in order to reproduce the observed intensities of the 12CO(6–5) and especially the 13CO(6–5) lines. Uncertainties are much reduced.
The low-pressure gas is not very dense (500–3000 cm−3) but tends to be hot with kinetic temperatures from 60 K to 150 K. The high-pressure gas is always very dense (0.5 − 1.0 × 105 cm−3 or higher) and significantly cooler with temperatures ranging from 20 K to 60 K. Only in NGC 3034 (M 82) both gas phases have similar temperatures of about 100 K.
Two of the twelve galaxies in Table 7 stand out with gas of a single phase responsible for essentially all of their CO line emission. Hot, moderately dense low-pressure gas produces over 95% of the emission from the center of NGC 1068 independent of transition observed, but a small amount of cold, dense gas is still required to explain the data. Having observed the lower transitions of HCN, HCO+ and CO isotopologues with the arcsec-sized SMA and NOEMA beams, Krips et al. (2011) obtained a very similar result. Almost all of the emission arises from the gas within ∼150 pc from the active Seyfert nucleus only resolved by interferometer arrays. The circumnuclear gas in the starburst-dominated center of IC 342 is also of limited extent but here it is the high-pressure gas that provides almost all of the CO line emission from this nearby nucleus. The cool and very dense gas in this reservoir produces typically 90% of the CO emission again independent of observed transition. Only ten per cent of the gas in the IC 342 nuclear region is moderately dense but rather hot which was also concluded by Rigopoulou et al. (2013), see also Montero-Castaño et al. (2006).
In two other galaxies, NGC 4945 and NGC 5236 (M 83), both warm and modestly dense low-pressure gas and much more dense and colder high-pressure gas contribute in roughly equal amounts to the J = 1–0 CO groundstate emission. Similar to IC 342, these are relatively nearby galaxies and the line measurements sample only the gas reservoirs in the inner few hundred parsecs. In the likewise nearby galaxies NGC 253 and NGC 3034 (M 82) the high-pressure gas is, however, only a minor contributor to the groundstate CO emission as is also the case in the other six galaxies.
Thus, the J = 1–0 12CO emission from all but three of the observed galaxy centers primarily originates in low-pressure gas reservoirs. More than 85 per cent of the groundstate emission from these galaxies which dominates their molecular gas mass represents moderately dense gas at kinetic temperatures above 60 K and reaching as high as 150 K. Both temperature and density suggest a heating mechanism other than UV and are more compatible with mechanical heating from decaying shocks and turbulent dissipation. Infrared spectroscopy with Herschel and Spitzer already suggested this for NGC 1097 (Beirão et al. 2012).
In all galaxies except NGC 1068 the situation is completely reversed in the J = 6–5 transition. More than 85 per cent of the 12CO(6–5) emission in these galaxy centers comes from relatively cool but rather dense molecular gas reservoirs in most cases representing a minor fraction of the total mass.
The high-pressure gas has an optical depth of a few in the J = 6–5 transition. Although it is radiatively important, its source of excitation is not clear-cut as various mechanisms may compete as discussed, for instance, by Rosenberg et al. (2014) for the case of NGC 253. If the high-J 12CO emission originates in thin outer layers of molecular clouds, it could trace high-density gas excited by external UV radiation. The low temperature, the angular extent of the 12CO(6–5) emission and the apparent lack of accompanying 13CO emission in NGC 253 and NGC 4945 are, however, more consistent with an extended diffuse gas excited throughout its entire volume by mechanical heating (see Loenen et al. 2008; Kazandjian et al. 2015; Paper II).
6. Conclusion
In this paper we have summarized all fourteen presently available sets of Jupp ≥ 5 13CO measurements of galaxies beyond the Local Group. Together with the more abundant 12CO(6–5) measurements, they yield thirteen J = 6–5 12CO/ 13CO isotopologue ratios for comparison with Jupp ≤ 3 ratios established earlier. The distances of the sample galaxies range from 3.5 to 21.5 Mpc. We also observed the LIRG NGC 6240 at a distance of 116 Mpc but did not include it in the analysis because of its discrepant nature. We have determined 12CO(6–5) intensities in multiple apertures ranging from 9″ to 43″ in ten galaxies. On average, the surface brightness of the galaxies in this sample is roughly inversely proportional to aperture size, indicating centrally peaked emission. The 12CO(6–5) emission reduced to 22″ apertures is relatively bright with velocity-integrated (6–5)/(1–0) brightness temperature ratios ranging from 0.12 to 0.45. A wider sample of galaxies observed in a 43″ aperture yields on average significantly lower ratios of (6–5)/(1–0), suggesting that the larger apertures include a higher fraction of low-excitation gas and that molecular gas excitation increases towards galaxy nuclei. Line intensities of 12CO(6–5) and 13CO(6–5) are weakly correlated with those of HCO+ and not at all with those of HCN, although all three lines have similar (critical) densities and presumably kinetic temperatures.
This paper not only covers all extragalactic 13CO(6–5) measurements available to date but, by implication, also all available intensity ratios J = 6–5 12CO/ 13CO that can be compared to those of the lower Jupp ≤ 3 transitions. These ratios are the emission-weighted average of a variety of molecular cloud types ranging from dense and compact to tenuous and diffuse over relatively large areas. In about a third of the galaxies observed, the isotopologue intensity ratios vary little with transition, in the remaining two thirds the J = 6–5 ratio is notably higher than the ratio in the lower transitions seen in somewhat larger apertures. In four galaxies, ratios determined in the fifteen times larger Herschel aperture increase with observed transition to much higher values of typically 30. The increase to high values occurs around the J = 5–4 transition.
The actual 12CO and 13CO intensities in the Jupp ≥ 6 transitions are not easily predicted from the Jupp ≤ 3 transitions routinely available from ground based facilities. The low-J and high-J lines originate in different and mostly unrelated gas phases. Widely accessible 12CO line intensities in the J = 1–0 through J = 3–2 transitions fail to fully constrain these gas phases even when they are accompanied by complementary 13CO observations. We find from our two-phase RADEX models that additional 13CO line intensities in the J = 6–5 transition or higher eliminate much of the degeneracy and consequent uncertainty in the underlying physical parameters of the molecular gas. For the majority of galaxies the models indicate that most of the observed J = 6–5 12CO and 13CO emission arises in a warm (Tkin ≥ 20K) and very dense (n H2 ≳ 105 cm−3 gas. The observed J = 6–5 CO emission is important as a tracer of inner galaxy energetics but not as a tracer of inner galaxy molecular gas mass.
Data availability
A copy of the reduced spectra as FITS files is available at the CDS via anonymous ftp to cdsarc.cds.unistra.fr (130.79.128.5) or via https://cdsarc.cds.unistra.fr/viz-bin/cat/J/A+A/691/A289
Acknowledgments
We gratefully acknowledge the ESO APEX User support supplied by Carlos de Breuck. We thank Enrica Bellocchi for supplying us with the Herschel-SPIRE intensities of NGC 4945 in Table 6, and Dimitra Rigopoulou for communicating the Herschel-SPIRE data for IC 342 in advance of publication.
References
- Baryshev, A. M., Hesper, R., Mena, F. P., et al. 2015, A&A, 577, A129 [NASA ADS] [CrossRef] [EDP Sciences] [Google Scholar]
- Bayet, E., Gerin, M., Phillips, T. G., & Contursi, A. 2004, A&A, 427, 45 [NASA ADS] [CrossRef] [EDP Sciences] [Google Scholar]
- Bayet, E., Gerin, M., Phillips, T. G., & Contursi, A. 2006, A&A, 467, 485 [Google Scholar]
- Bayet, E., Aladro, R., Martín, S., Vitim, S., & Martín-Pintado, J. 2009, ApJ, 707, 126 [NASA ADS] [CrossRef] [Google Scholar]
- Beirão, P., Armus, L., Helou, G., et al. 2012, ApJ, 751, 144 [CrossRef] [Google Scholar]
- Belitsky, V., Lapkin, I., Fredrixon, M., et al. 2018, A&A, 612, A23 [NASA ADS] [CrossRef] [EDP Sciences] [Google Scholar]
- Bellocchi, E., Martín-Pintado, J., Güsten, T., et al. 2020, A&A, 642, A166 [NASA ADS] [CrossRef] [EDP Sciences] [Google Scholar]
- Carilli, C. L., & Walter, F. 2013, ARA&A, 51, 105 [NASA ADS] [CrossRef] [Google Scholar]
- Chou, R. C. Y., Peck, A. B., Lim, J., et al. 2007, ApJ, 670, 116 [NASA ADS] [CrossRef] [Google Scholar]
- Crocker, A. F., Pellegrini, E., Smith, J.-D. T., et al. 2019, ApJ, 887, 105 [NASA ADS] [CrossRef] [Google Scholar]
- Fixsen, D. J., Bennett, C. L., & Mather, J. C. 1999, ApJ, 526, 207 [Google Scholar]
- Greve, T. R., Papadopoulos, P. P., Gao, Y., & Radford, S. J. E. 2009, ApJ, 692, 1432 [Google Scholar]
- Greve, T. R., Leonidaki, I., Xilouris, E. M., et al. 2014, ApJ, 794, 142 [NASA ADS] [CrossRef] [Google Scholar]
- Güsten, R., Nyman, L. A., Schilke, P., et al. 2006, A&A, 454, L13 [NASA ADS] [CrossRef] [EDP Sciences] [Google Scholar]
- Güsten, R., Baryshev, A., Bell, A., et al. 2008, SPIE Conf. Ser., 7020, 702010 [Google Scholar]
- Hailey-Dunsheath, S., Nikola, T., Stacey, G. J., et al. 2008, ApJ, 689, L109 [NASA ADS] [CrossRef] [Google Scholar]
- Harris, A. I., Hills, R. E., Stutzki, J., et al. 1991, ApJ, 382, L75 [NASA ADS] [CrossRef] [Google Scholar]
- Israel, F. P. 2005, A&A, 438, 855 [NASA ADS] [CrossRef] [EDP Sciences] [Google Scholar]
- Israel, F. P. 2020, A&A, 635, A131 (Paper I) [NASA ADS] [CrossRef] [EDP Sciences] [Google Scholar]
- Israel, F. P. 2023, A&A, 671, A59 (Paper II) [NASA ADS] [CrossRef] [EDP Sciences] [Google Scholar]
- Israel, F. P., & Baas, F. 2001, A&A, 371, 433 [NASA ADS] [CrossRef] [EDP Sciences] [Google Scholar]
- Israel, F. P., Güesten, R., Meijerink, R., et al. 2014, A&A, 562, A96 [NASA ADS] [CrossRef] [EDP Sciences] [Google Scholar]
- Jansen, D. 1995, Ph.D. Thesis, Sterrewacht, Leiden University (NL) [Google Scholar]
- Kamenetzky, J., Glenn, J., Rangwala, N., et al. 2012, ApJ, 753, 70 [Google Scholar]
- Kamenetzky, J., Rangwala, N., Glenn, J., Maloney, P. R., & Conley, A. 2016, ApJ, 829, 93 [Google Scholar]
- Kamenetzky, J., Rangwala, N., & Glenn, J. 2017, MNRAS, 471, 2917 [Google Scholar]
- Kasemann, C., Güsten, R., Heyminck, S., et al. 2006, Proc. SPIE, 6275, 62750U [Google Scholar]
- Kazandjian, M., Meijerink, R., Pelupessy, F. I., Israel, F. P., & Spaans, M. 2015, A&A, 574, A127 [NASA ADS] [CrossRef] [EDP Sciences] [Google Scholar]
- Krips, M., Martín, S., Eckart, A., et al. 2011, ApJ, 736, 37 [NASA ADS] [CrossRef] [Google Scholar]
- Loenen, A. F., Spaans, M., Baan, W. A., & Meijerink, R. 2008, A&A, 488, L5 [NASA ADS] [CrossRef] [EDP Sciences] [Google Scholar]
- Loenen, A. F., van der Werf, P. P., Güesten, R., et al. 2010, A&A, 521, L21 [NASA ADS] [CrossRef] [EDP Sciences] [Google Scholar]
- Lu, N., Zhao, Y., Díaz-Santos, T., et al. 2017, ApJS, 230, 1 [Google Scholar]
- Mashian, N., Sturm, E., Sternbereg, A., et al. 2015, ApJ, 802, 81 [NASA ADS] [CrossRef] [Google Scholar]
- Meijerink, R., Kristensen, L. E., Weisz, A., et al. 2013, ApJ, 762, L16 [NASA ADS] [CrossRef] [Google Scholar]
- Montero-Castaño, M., Herrnstein, R. M., & Ho, P. T. P. 2006, ApJ, 646, 919 [CrossRef] [Google Scholar]
- Panuzzo, P., Rangwala, N., Rykala, A., et al. 2010, A&A, 518, L37 [NASA ADS] [CrossRef] [EDP Sciences] [Google Scholar]
- Papadopoulos, P. P., van der Werf, P., Isaak, K., & Xilouris, E. M. 2010, ApJ, 715, 775 [Google Scholar]
- Papadopoulos, P. P., Zhang, Z.-Y., Xilouris, E. M., et al. 2014, ApJ, 788, 153 [CrossRef] [Google Scholar]
- Pérez-Beaupuits, J. P., Güsten, R., Harris, A., et al. 2018, ApJ, 860, 23 [Google Scholar]
- Piñol-Ferrer, N., Fathi, K., Lundgren, A., & van de Ven, G. 2011, MNRAS, 414, 529 [CrossRef] [Google Scholar]
- Priestley, F. D., Clark, P. C., Golver, S. O. C., et al. 2024, MNRAS, 531, 4408 [NASA ADS] [CrossRef] [Google Scholar]
- Rigopoulou, D., Hurley, P. D., Swinyard, B. M., et al. 2013, MNRAS, 434, 2051 [Google Scholar]
- Rosenberg, M. J. F., Kazandjian, M. V., van der Werf, P. P., et al. 2014, A&A, 564, A126 [NASA ADS] [CrossRef] [EDP Sciences] [Google Scholar]
- Rosenberg, M. J. F., van der Werf, P. P., Aalto, S., et al. 2015, ApJ, 801, 72 [Google Scholar]
- Schöier, F. L., van der Tak, F. F. S., van Dishoeck, E. F., & Black, J. H. 2005, A&A, 432, 369 [Google Scholar]
- Seaquist, E. R., Lee, S. W., & Moriarty-Schieven, G. H. 2006, ApJ, 638, 148 [NASA ADS] [CrossRef] [Google Scholar]
- Shirley, Y. L. 2015, PASP, 127, 299 [Google Scholar]
- Tang, X. D., Henkel, C., Menten, K. M., et al. 2019, A&A, 629, A6 [NASA ADS] [CrossRef] [EDP Sciences] [Google Scholar]
- van der Tak, F. F. S., Black, J. H., Schöier, F. L., et al. 2007, A&A, 468, 627 [NASA ADS] [CrossRef] [EDP Sciences] [Google Scholar]
- Viti, S., Fontani, F., & Jiménez-Srra, I. 2020, MNRAS, 497, 4333 [NASA ADS] [CrossRef] [Google Scholar]
- Ward, J. S., Zmuidzinas, J., Harris, A. I., & Isaak, K. G. 2003, ApJ, 587, 171 [NASA ADS] [CrossRef] [Google Scholar]
- Weiss, A., Downes, D., Walter, F., & Henkel, C. 2007, ASP Conf. Ser., 375, 25 [NASA ADS] [Google Scholar]
All Tables
All Figures
|
Fig. 1. Observed J = 6–5 12CO (top) and J = (6–5) 13CO (bottom ) profiles of galaxy centers. Horizontal scale velocity (VLSR in km s−1, vertical scale observed antenna temperature TA*. Note the overall weakness of 13CO lines. |
| In the text | |
|
Fig. 2. Integrated 12CO(6–5) line intensities as a function of aperture. For clarity sake, points for NGC 1808 and NGC 660 were shifted down by 0.80 and 0.85, respectively. Solid lines are least-squares fits to the data. Six galaxies have poor data coverage and are not shown. NGC 613, IC 342, and NGC 2559 have a single data point each. NGC 4945, NGC 5236, and NGC 6240 have only two data points each. |
| In the text | |
|
Fig. 3. Comparison of observed line ratios. Straight lines mark least-squares linear fits to the data displayed. Top row: comparison of J = 6–5 and J = 3–2 line intensities normalized by J = 1–0 intensity. Left: 12CO ratios in 43″ apertures. Open circle marks the Inner Galaxy including Galactic Nucleus. Center: 12CO ratios in 22″ apertures. Open circle marks the Galactic Center; open square marks the starburst dwarf galaxy He2-10. In both panels, the relatively nearby galaxies at distances D ≤ 6.5 Mpc are marked by a cross. Right: 13CO ratios in extrapolated 11″ apertures. Bottom row: comparison of isotopologue intensities in (extrapolated) 11″ apertures. Left: comparison of the 13CO and 12CO J = 6–5/J = 1–0 intensity ratios. Center: comparison of the J = 6-5 isotopologue intensity ratios and the 13CO J = 6–5/J = 1–0 intensity ratios. The outlier NGC 6240 is not included. Right: isotopologue intensity ratios as a function of 12CO(6–5)/ 12CO(1–0) intensity ratios. The J = 1–0 isotopological ratios are assumed to be identical in 11″ and 22″ apertures. Filled circles mark isotopological intensity ratios in the J = 6–5 transition, open circles those in the J = 1–0 transition. |
| In the text | |
|
Fig. 4. Top: 12CO (6–5)/(1–0) intensity ratios as a function of HCN(1–0), HCO+ and HCO+(3–2) line intensities relative to 12CO(1–0). All ratios refer to a resolution of 22″, except the 13CO (6–5)/(1–0) ratios that refer to extrapolated 11″ apertures (cf. Sect. 4.3). The central and rightmost panels include linear fits to the data. Bottom: the same as the top row, but with 13CO lines substituted for 12CO lines. The dashed line in the rightmost panel is an eyeball fit to the limited data. |
| In the text | |
Current usage metrics show cumulative count of Article Views (full-text article views including HTML views, PDF and ePub downloads, according to the available data) and Abstracts Views on Vision4Press platform.
Data correspond to usage on the plateform after 2015. The current usage metrics is available 48-96 hours after online publication and is updated daily on week days.
Initial download of the metrics may take a while.