Fig. 3.
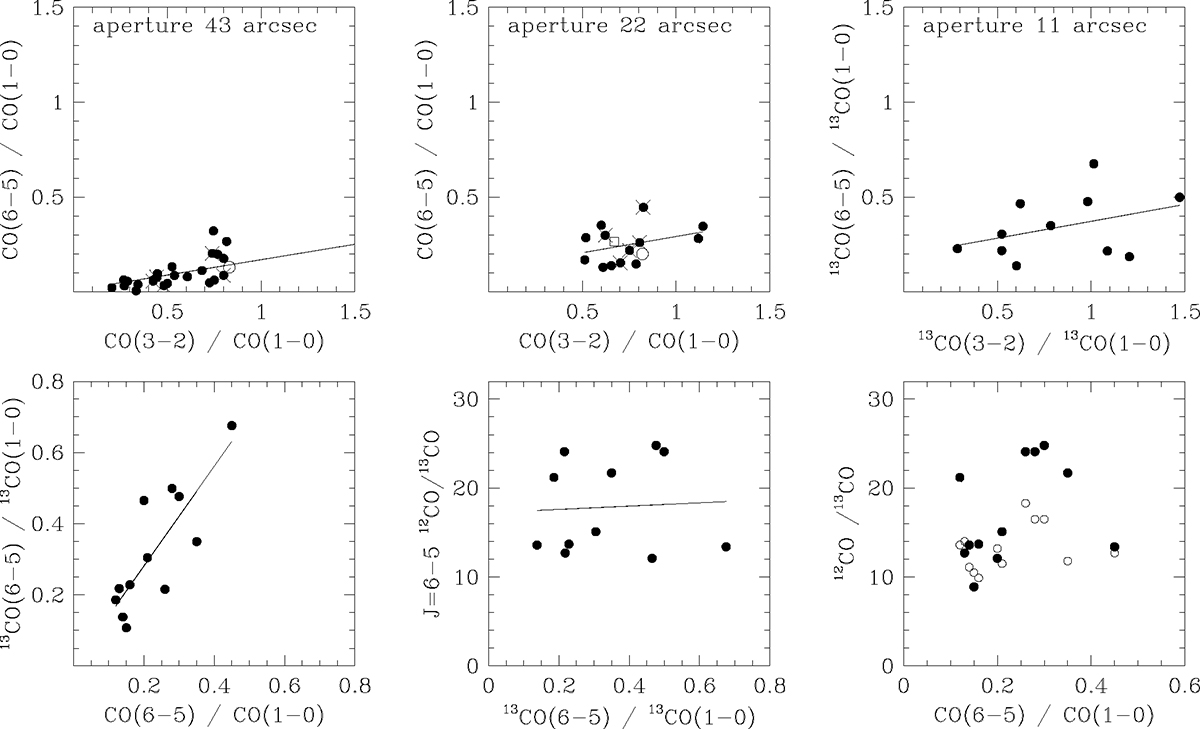
Download original image
Comparison of observed line ratios. Straight lines mark least-squares linear fits to the data displayed. Top row: comparison of J = 6–5 and J = 3–2 line intensities normalized by J = 1–0 intensity. Left: 12CO ratios in 43″ apertures. Open circle marks the Inner Galaxy including Galactic Nucleus. Center: 12CO ratios in 22″ apertures. Open circle marks the Galactic Center; open square marks the starburst dwarf galaxy He2-10. In both panels, the relatively nearby galaxies at distances D ≤ 6.5 Mpc are marked by a cross. Right: 13CO ratios in extrapolated 11″ apertures. Bottom row: comparison of isotopologue intensities in (extrapolated) 11″ apertures. Left: comparison of the 13CO and 12CO J = 6–5/J = 1–0 intensity ratios. Center: comparison of the J = 6-5 isotopologue intensity ratios and the 13CO J = 6–5/J = 1–0 intensity ratios. The outlier NGC 6240 is not included. Right: isotopologue intensity ratios as a function of 12CO(6–5)/ 12CO(1–0) intensity ratios. The J = 1–0 isotopological ratios are assumed to be identical in 11″ and 22″ apertures. Filled circles mark isotopological intensity ratios in the J = 6–5 transition, open circles those in the J = 1–0 transition.
Current usage metrics show cumulative count of Article Views (full-text article views including HTML views, PDF and ePub downloads, according to the available data) and Abstracts Views on Vision4Press platform.
Data correspond to usage on the plateform after 2015. The current usage metrics is available 48-96 hours after online publication and is updated daily on week days.
Initial download of the metrics may take a while.