Fig. 3.
Download original image
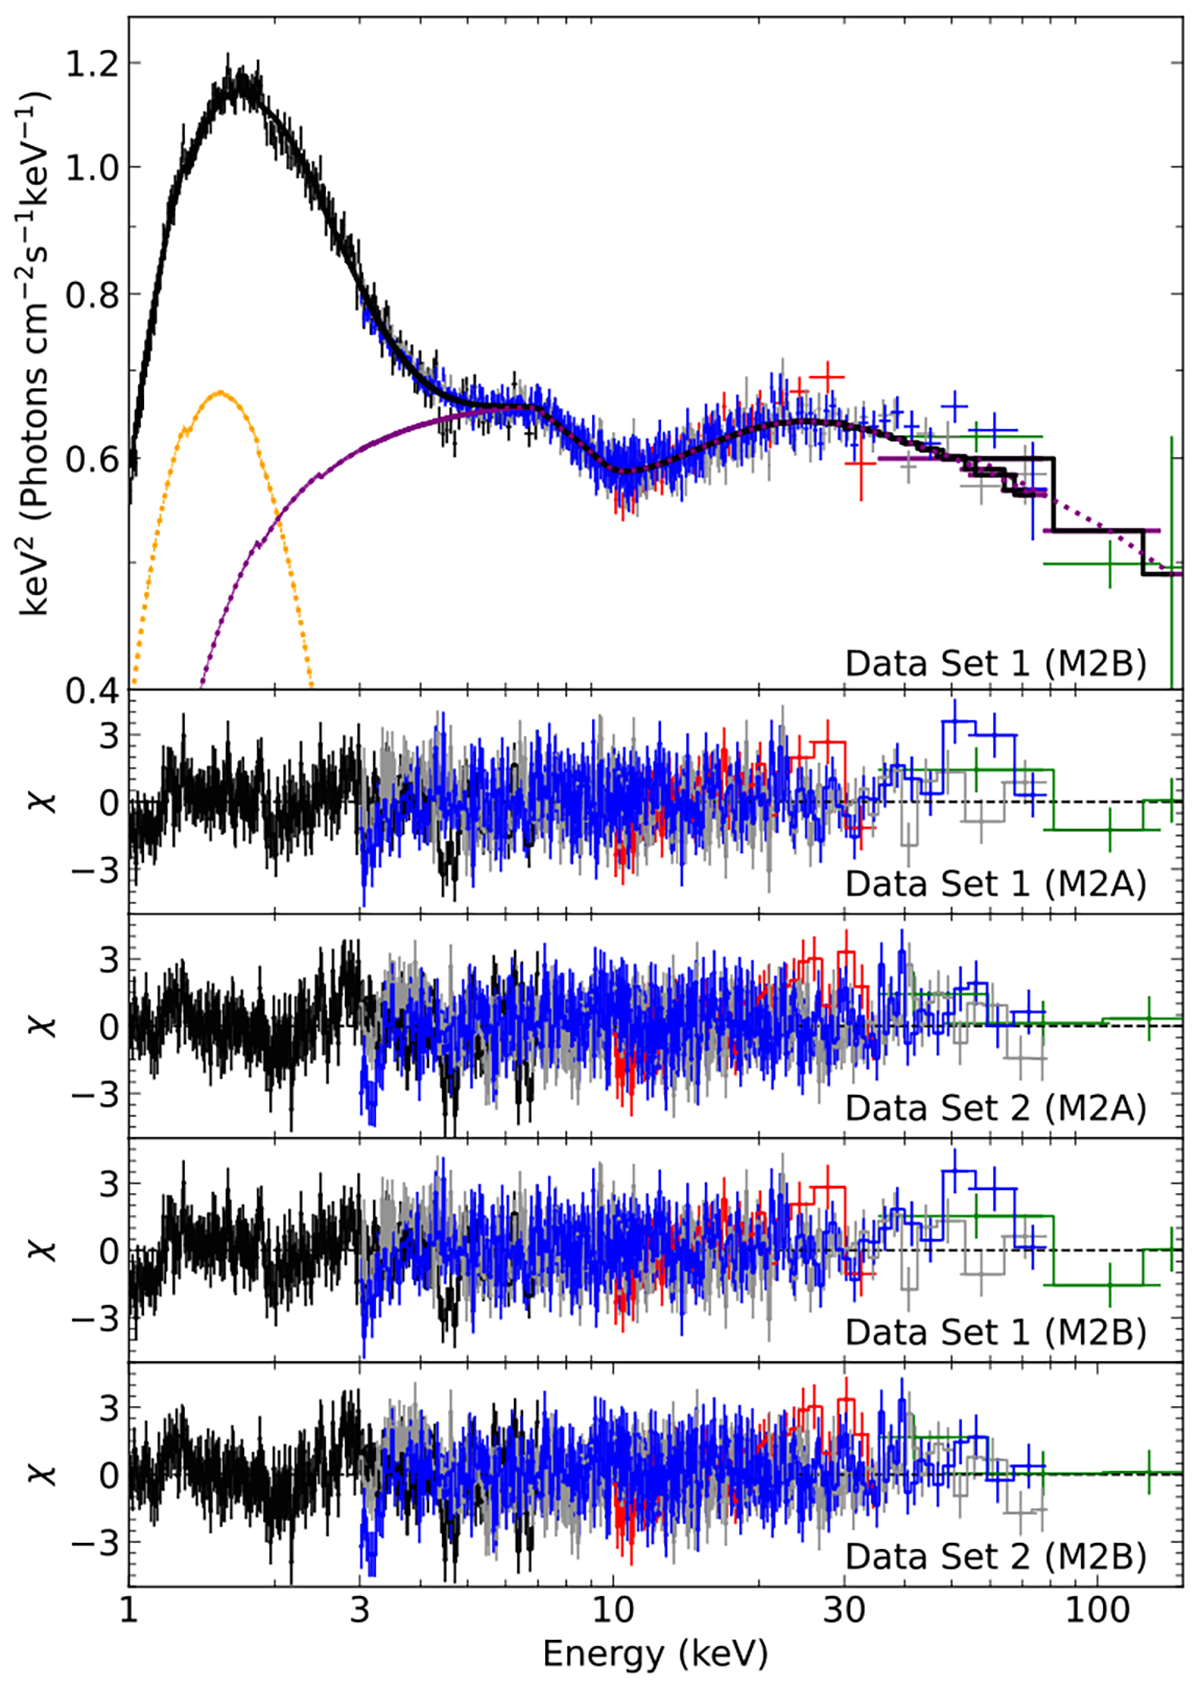
Spectra (black for Insight-HXMT/LE, red for Insight-HXMT/ME, green for Insight-HXMT/HE, gray for NuSTAR/FPMA and blue for NuSTAR/FPMB), model components of M2B, and spectral residuals of M2A and M2B. The black solid line is the total model fitted to the data, and the yellow and purple dotted lines show the kerrbb2 and relxill spectral components, respectively. The models are plotted based on the best-fit parameters obtained from Insight-HXMT.
Current usage metrics show cumulative count of Article Views (full-text article views including HTML views, PDF and ePub downloads, according to the available data) and Abstracts Views on Vision4Press platform.
Data correspond to usage on the plateform after 2015. The current usage metrics is available 48-96 hours after online publication and is updated daily on week days.
Initial download of the metrics may take a while.