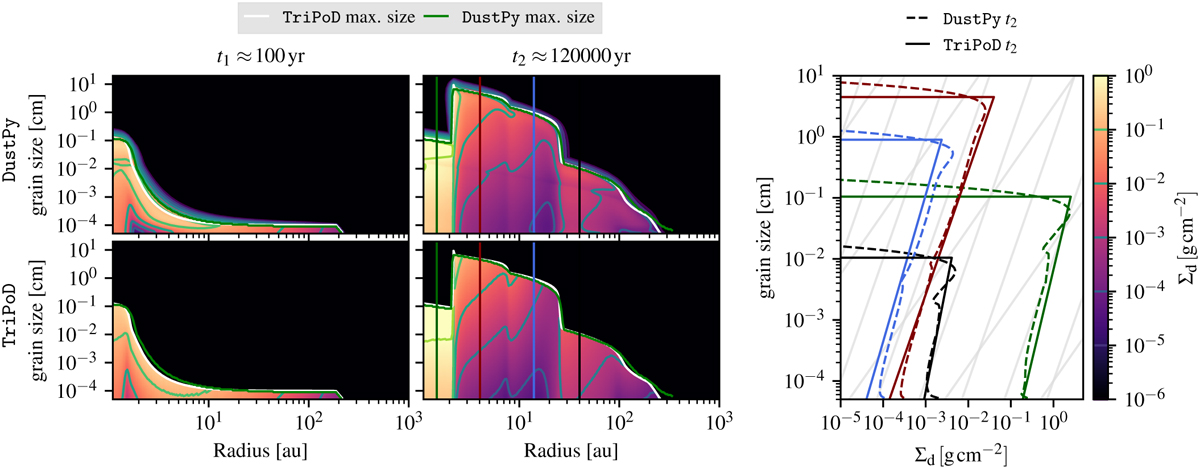
Fig. 9
Download original image
Comparison between a DustPy simulation and a PLUTO simulation with our TriPoD dust coagulation model of a protoplanetary disk with radially varying fragmentation velocity (see Eq. (59)). The left and center columns depict the global dust distribution at two different snapshots of the simulations, with the DustPy simulation in the top row and the TriPoD simulation at the bottom. The right plot shows the local dust size distributions in the second snapshot at the locations of the vertical lines of the same color in the central panel. The gray lines in the right panel follow power laws with q = −3.5 and q = −3.0.
Current usage metrics show cumulative count of Article Views (full-text article views including HTML views, PDF and ePub downloads, according to the available data) and Abstracts Views on Vision4Press platform.
Data correspond to usage on the plateform after 2015. The current usage metrics is available 48-96 hours after online publication and is updated daily on week days.
Initial download of the metrics may take a while.