Fig. 7
Download original image
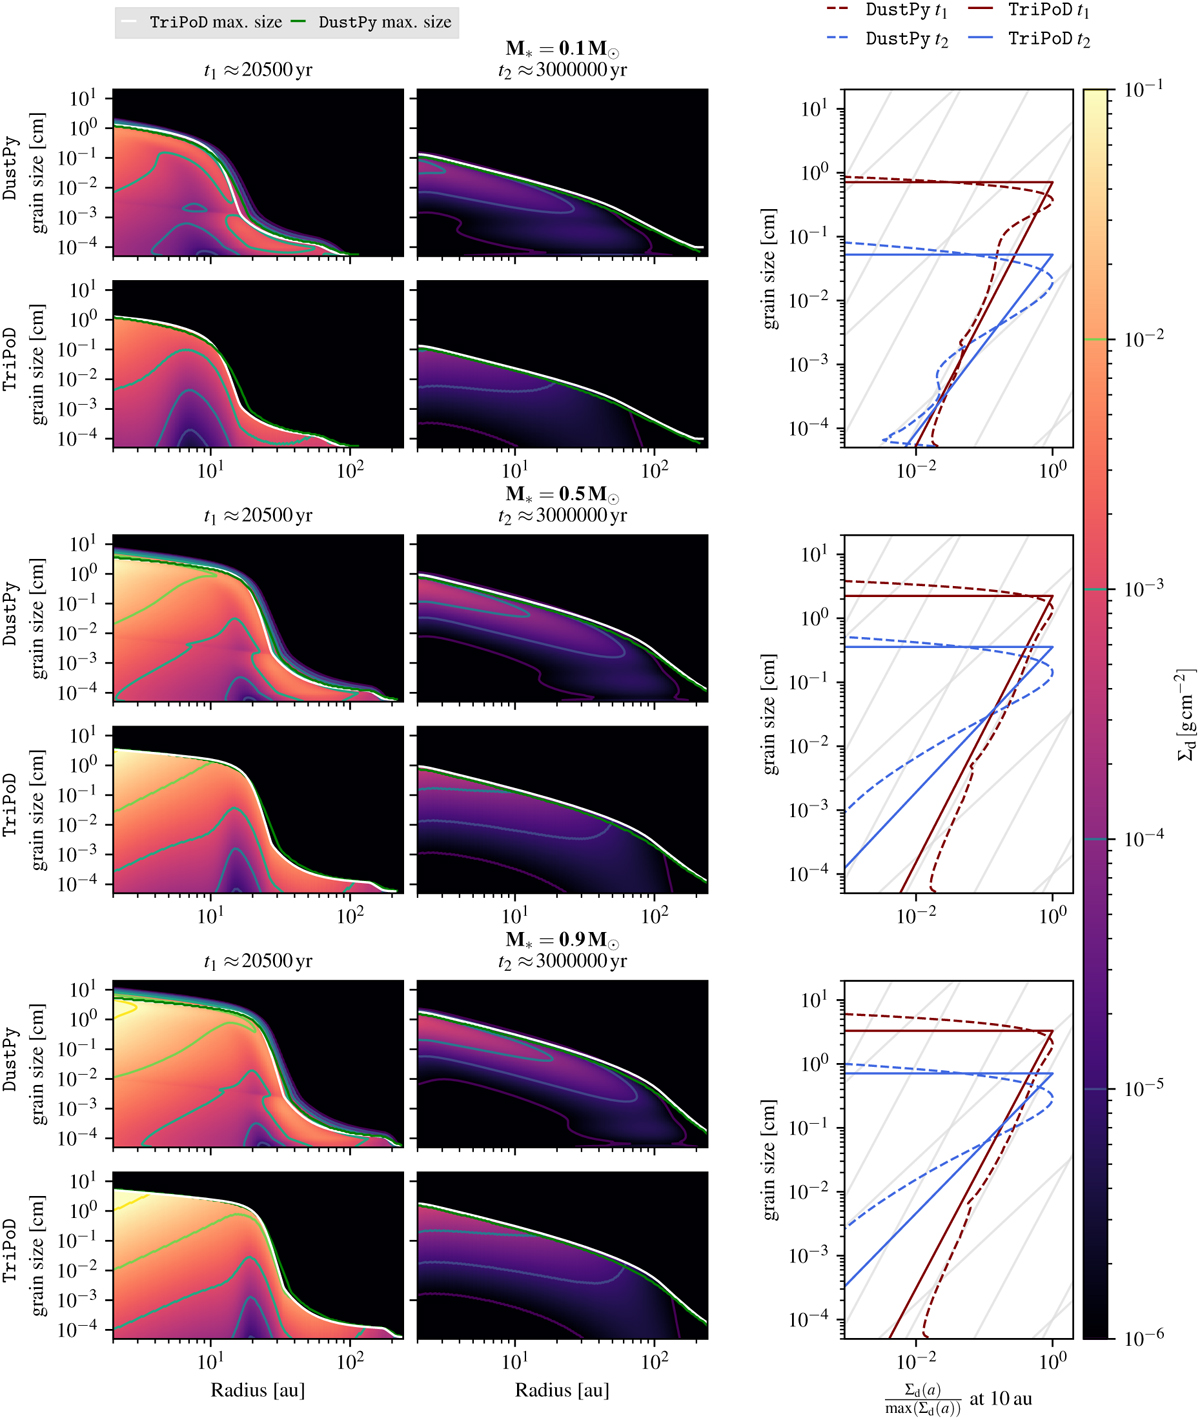
Comparison of the dust size distributions in three simulations with different stellar masses and different disk masses. The first row in each group depicts a DustPy simulation (full treatment of coagulation). The lower rows show the respective TriPoD simulations with the PLUTO code. Panels on the right depict the local dust size distributions at 10 au at both snapshots. The gray lines in the right panel follow power laws with q = −3.5 and q = −3.0.
Current usage metrics show cumulative count of Article Views (full-text article views including HTML views, PDF and ePub downloads, according to the available data) and Abstracts Views on Vision4Press platform.
Data correspond to usage on the plateform after 2015. The current usage metrics is available 48-96 hours after online publication and is updated daily on week days.
Initial download of the metrics may take a while.