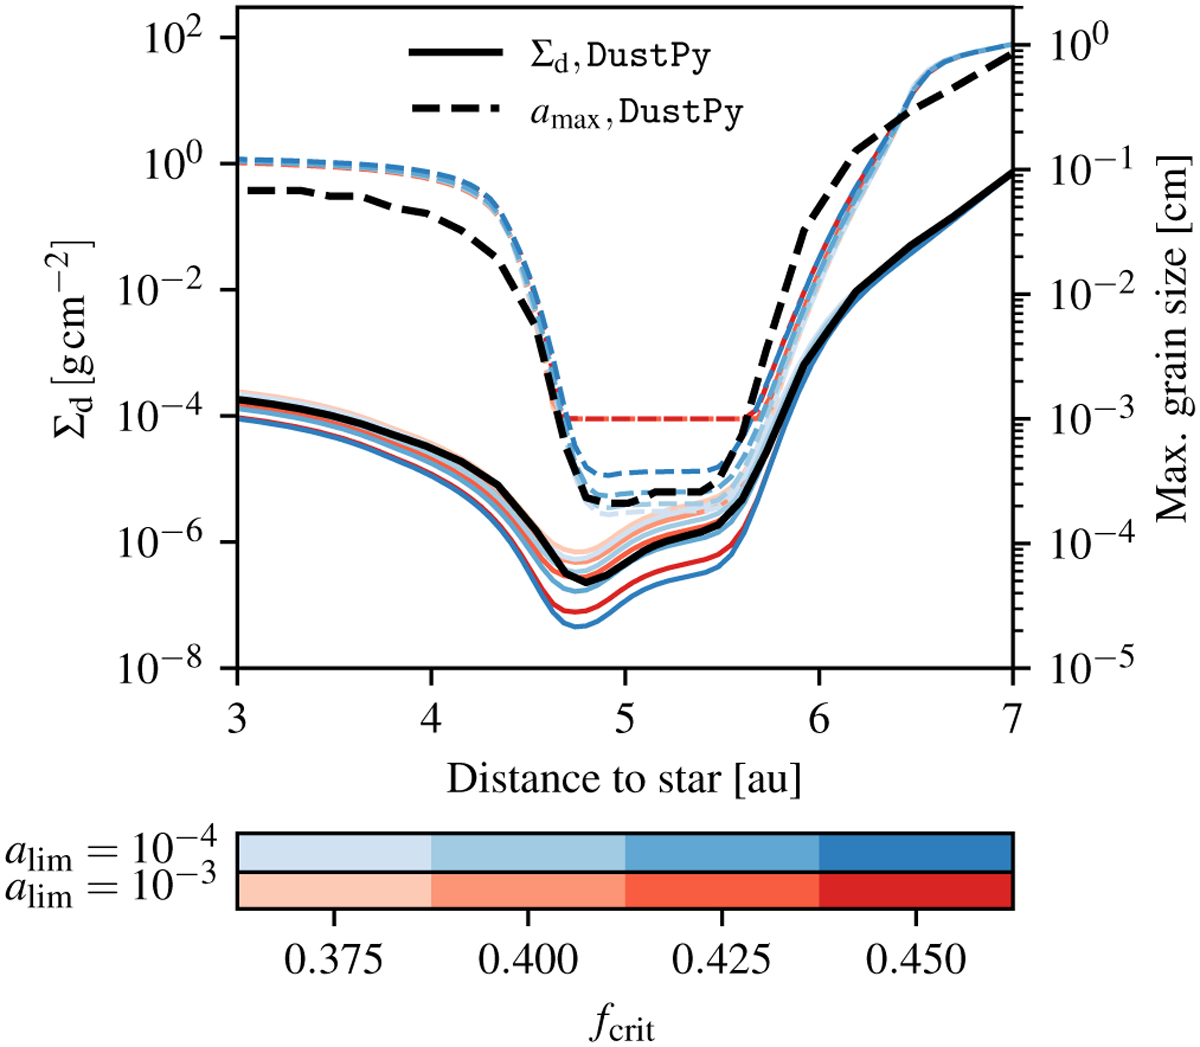
Fig. 6
Download original image
Test for the size reduction in planetary gaps. The dashed lines correspond to the maximum grain size of the respective model (see color bars for the model parameters), while the solid lines show the dust column density for each model. Thick black lines correspond to the respective DustPy simulation that we want to reproduce. The particle size is reduced on the dust depletion timescale when the large dust population makes up less than the critical fraction ƒcrit of the total dust density. We run these simulations to determine which value leads to the best agreement with the DustPy simulation.
Current usage metrics show cumulative count of Article Views (full-text article views including HTML views, PDF and ePub downloads, according to the available data) and Abstracts Views on Vision4Press platform.
Data correspond to usage on the plateform after 2015. The current usage metrics is available 48-96 hours after online publication and is updated daily on week days.
Initial download of the metrics may take a while.