Fig. 2
Download original image
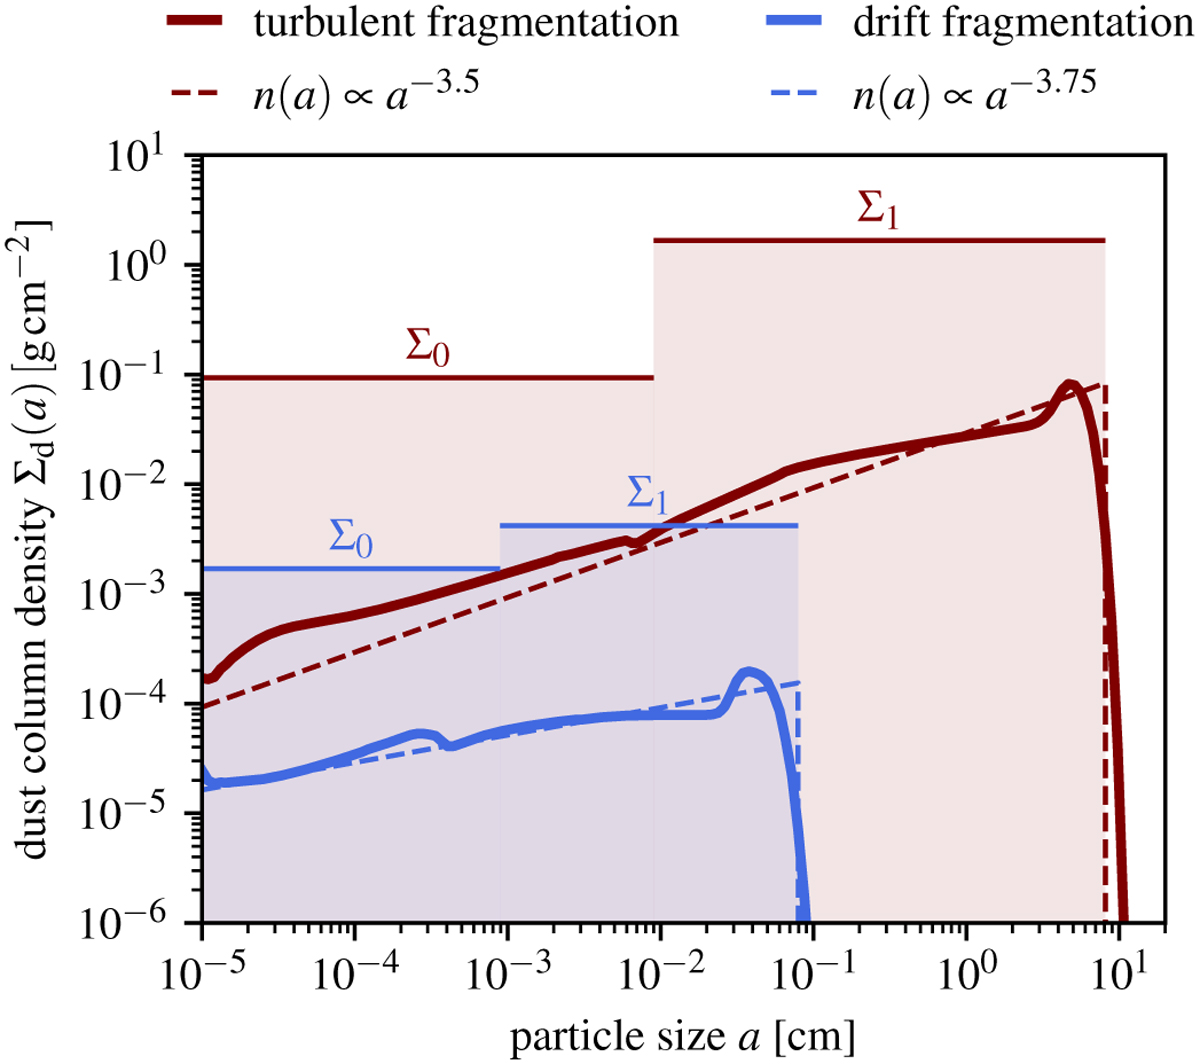
Typical size distributions in regions of a protoplanetary disk model that are either turbulence-dominated (dark red lines) or drift- dominated (blue lines). Both regimes result in distinct power-law exponents of the distribution that we overplot as dashed lines. Assuming a power law as the overall shape of the distribution makes it possible to approximately describe it with only three parameters: The cutoff particle size amax and the two densities Σ0 (contained in the size interval [![]() ) and Σɪ (contained in the size interval [
) and Σɪ (contained in the size interval [![]() ]). This approximation is the basis of our new dust coagulation model.
]). This approximation is the basis of our new dust coagulation model.
Current usage metrics show cumulative count of Article Views (full-text article views including HTML views, PDF and ePub downloads, according to the available data) and Abstracts Views on Vision4Press platform.
Data correspond to usage on the plateform after 2015. The current usage metrics is available 48-96 hours after online publication and is updated daily on week days.
Initial download of the metrics may take a while.