Fig. E.1
Download original image
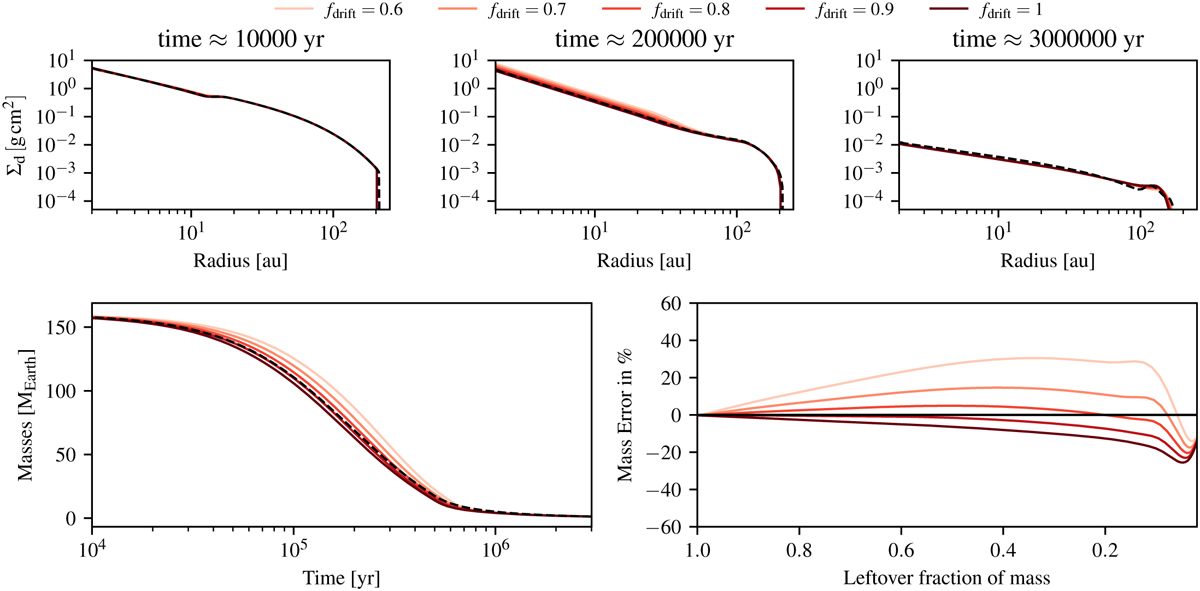
Comparison between DustPy and our model in a setup without dust diffusion and with different drift calibration factors fdrift. Solid lines show the results of our TriPoD calibration runs and dashed lines show the respective DustPy simulation, to which we calibrate our model. The upper row shows a timeseries of the dust column density evolution in three snapshots. In the lower row, we show the mass evolution and the errors with respect to the full coagulation model DustPy. For a factor of fdrift = 0.8, the mass evolution of the full coagulation model is well reproduced by our three-parameter model.
Current usage metrics show cumulative count of Article Views (full-text article views including HTML views, PDF and ePub downloads, according to the available data) and Abstracts Views on Vision4Press platform.
Data correspond to usage on the plateform after 2015. The current usage metrics is available 48-96 hours after online publication and is updated daily on week days.
Initial download of the metrics may take a while.