Fig. 11
Download original image
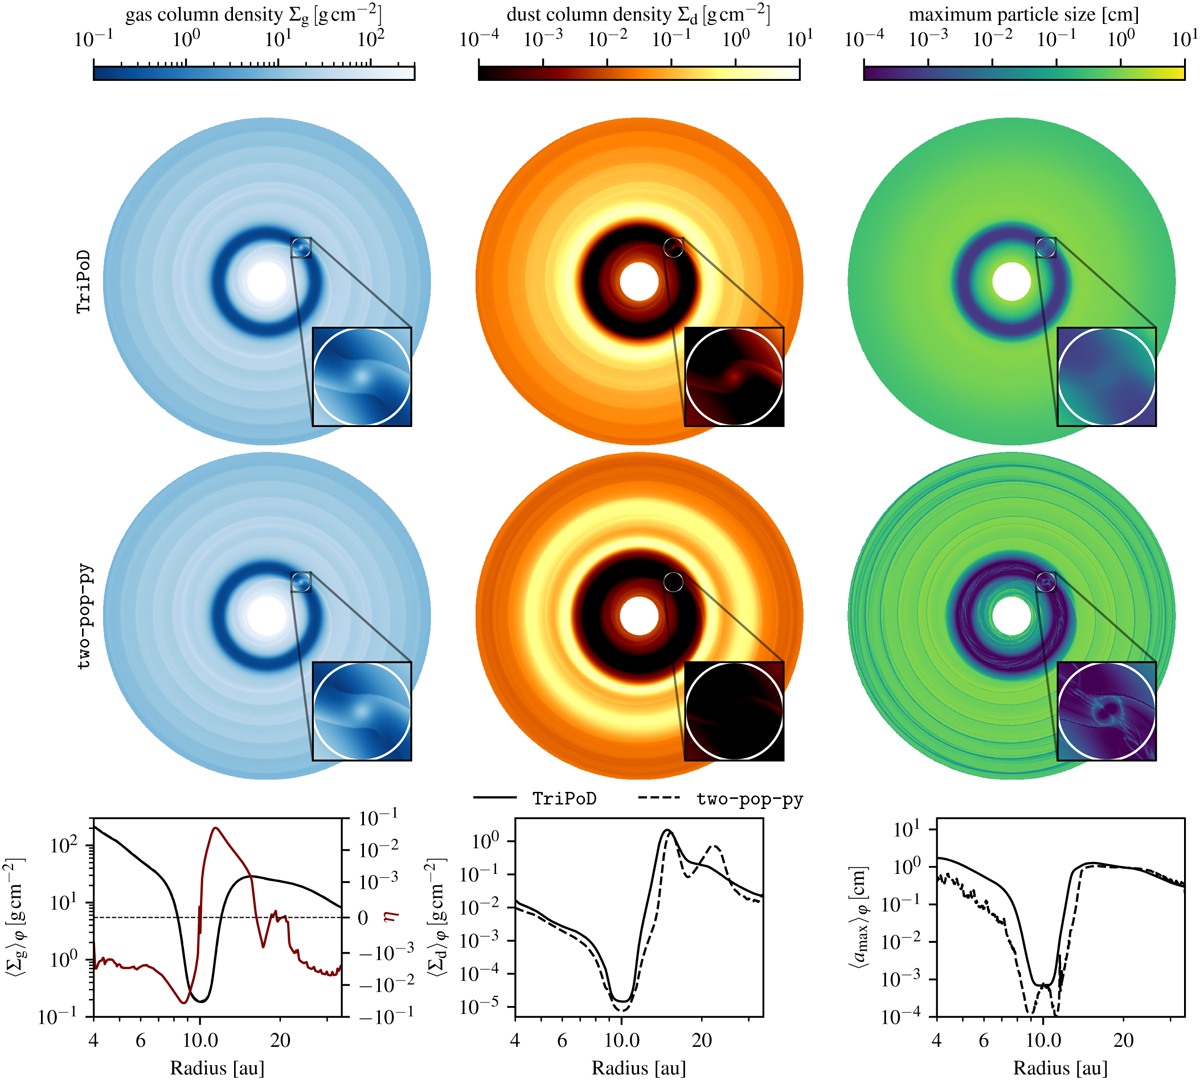
Comparison between two-dimensional PLUTO simulations with the TriPoD coagulation model and with the two-pop-py model. Both simulations have the exact same gas density structure and are only distinguished by the applied dust coagulation model. The lower panels show the azimuthally averaged quantities. For the azimuthal averages, we have masked the region around the planet that has been marked with the white circle. The red line in the left panel shows the radial pressure gradient parameter ![]() . It can be seen that in our simulation a weak second pressure maximum appears at ~20 au, which leads to strong trapping in the two-pop-py model (Birnstiel et al. 2012). This effect is much less pronounced if a polydisperse size distribution is considered as done in our TriPoD simulation, where the small dust population is less efficiently trapped.
. It can be seen that in our simulation a weak second pressure maximum appears at ~20 au, which leads to strong trapping in the two-pop-py model (Birnstiel et al. 2012). This effect is much less pronounced if a polydisperse size distribution is considered as done in our TriPoD simulation, where the small dust population is less efficiently trapped.
Current usage metrics show cumulative count of Article Views (full-text article views including HTML views, PDF and ePub downloads, according to the available data) and Abstracts Views on Vision4Press platform.
Data correspond to usage on the plateform after 2015. The current usage metrics is available 48-96 hours after online publication and is updated daily on week days.
Initial download of the metrics may take a while.