Fig. 9
Download original image
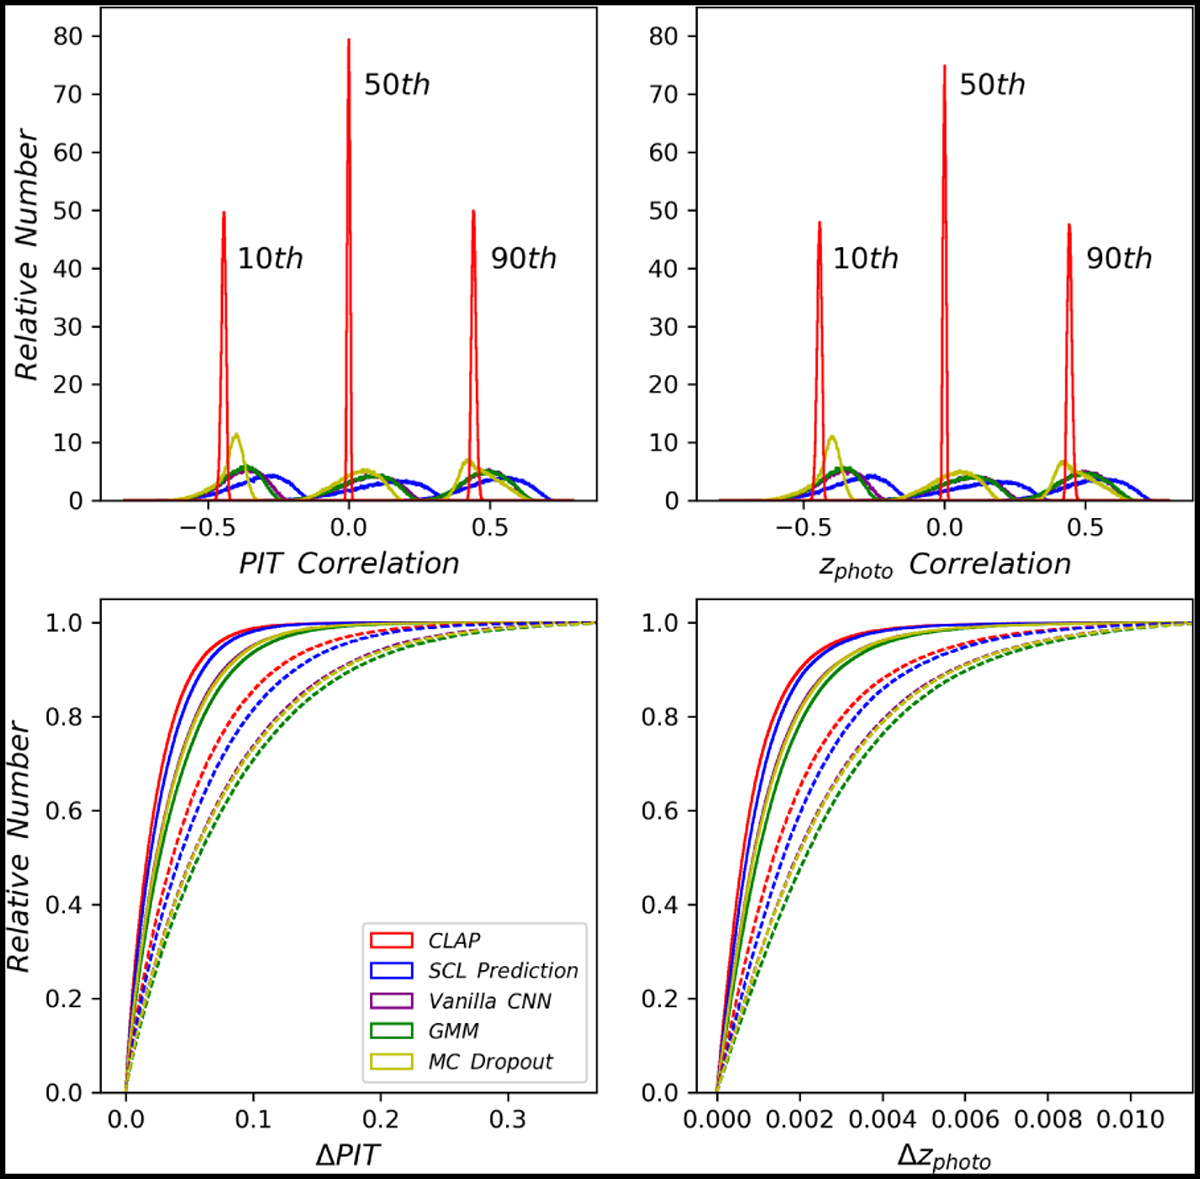
Correlation and uncertainty analysis for CLAP, the SCL prediction, the vanilla CNN, the GMM, and the MC dropout (detailed in the text). Upper panels: 10th, 50th, and 90th percentiles drawn from the distributions of PIT and zphoto correlations between each data instance (viewed as a ten-dimensional vector) and all the other data instances from the sample. Lower panels: distributions of PIT and zphoto uncertainties that are not accounted for by uncombined probability density estimates (dashed curves) or by a combination of five estimates (solid curves).
Current usage metrics show cumulative count of Article Views (full-text article views including HTML views, PDF and ePub downloads, according to the available data) and Abstracts Views on Vision4Press platform.
Data correspond to usage on the plateform after 2015. The current usage metrics is available 48-96 hours after online publication and is updated daily on week days.
Initial download of the metrics may take a while.