Fig. 8
Download original image
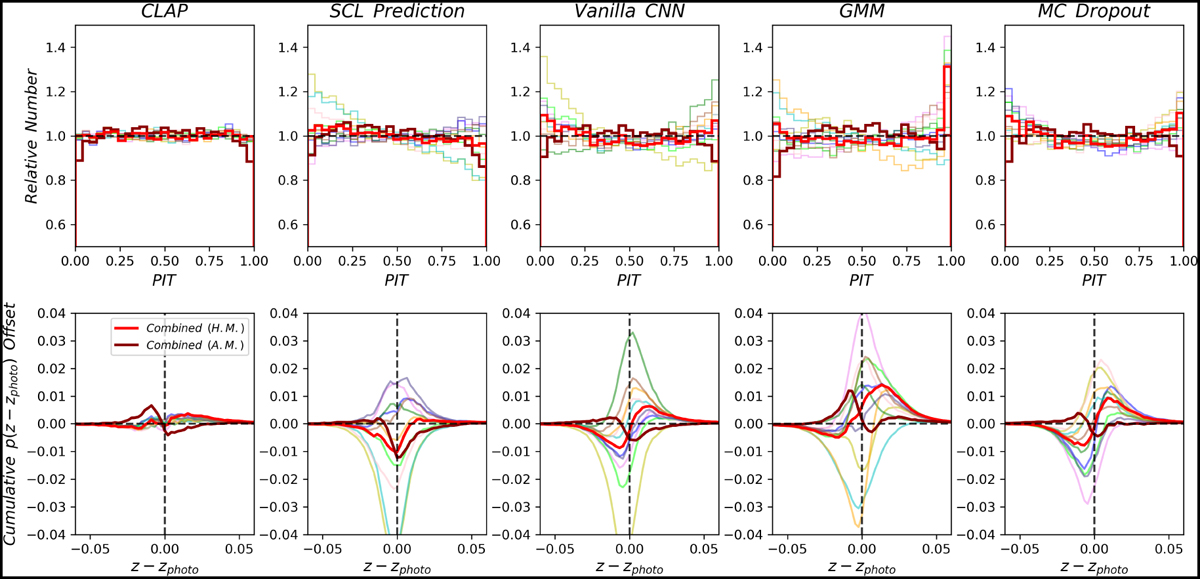
PIT distributions and cumulative offsets ![]() for CLAP, the SCL prediction, the vanilla CNN, the GMM, and the MC dropout (detailed in the text). The results for the ten uncombined probability density estimates in the ensemble for each method are shown in different colours. The results obtained by combining the ten estimates using the harmonic mean (H.M.) are shown in red, while those obtained using the arithmetic mean (A.M.) are shown in dark red. For the PIT, the y-axis in each panel is truncated at 0.5 for clearer illustration. For the cumulative offsets, the vertical dashed line in each panel indicates the zero point where z and zphoto coincide.
for CLAP, the SCL prediction, the vanilla CNN, the GMM, and the MC dropout (detailed in the text). The results for the ten uncombined probability density estimates in the ensemble for each method are shown in different colours. The results obtained by combining the ten estimates using the harmonic mean (H.M.) are shown in red, while those obtained using the arithmetic mean (A.M.) are shown in dark red. For the PIT, the y-axis in each panel is truncated at 0.5 for clearer illustration. For the cumulative offsets, the vertical dashed line in each panel indicates the zero point where z and zphoto coincide.
Current usage metrics show cumulative count of Article Views (full-text article views including HTML views, PDF and ePub downloads, according to the available data) and Abstracts Views on Vision4Press platform.
Data correspond to usage on the plateform after 2015. The current usage metrics is available 48-96 hours after online publication and is updated daily on week days.
Initial download of the metrics may take a while.