Fig. 7
Download original image
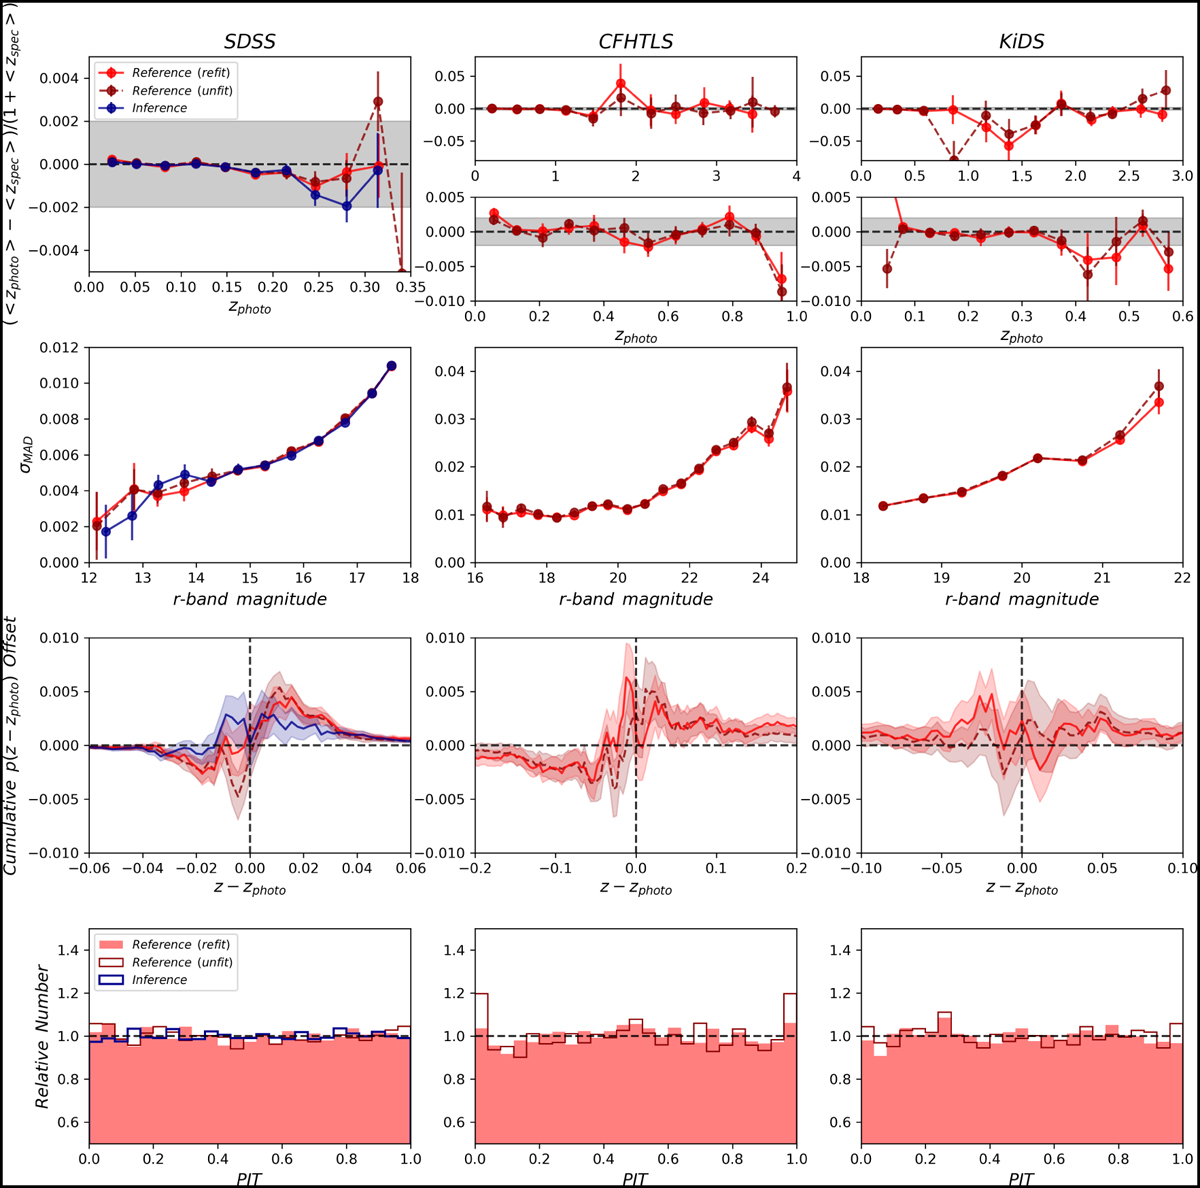
Outcomes of resuming end-to-end discriminative models by refitting in CLAP illustrated for the SDSS, CFHTLS, and KiDS target samples. The SDSS target sample is split into a reference subsample (used to refit the model) and an inference subsample (held out for inference), while the CFHTLS and KiDS target samples are only used as reference samples. The results obtained by No-NIR CLAP for the KiDS dataset are not shown in order to avoid redundancy. For each dataset, only one of the ten CLAP models in the ensemble is selected for demonstration. First row: mean redshift residuals as a function of photometric redshift zphoto computed using the reference samples with and without refitting. The results for the SDSS inference subsample are also shown. As in Fig. 6, the results for the CFHTLS and KiDS datasets are shown in the low redshift ranges in addition to the full ranges. Second row: σMAD as a function of r-band magnitude. Third row: cumulative offsets ![]() between each of the stacked recentred probability densities pΣ (z − zphoto) and the corresponding zspec − zphoto histogram. The vertical dashed line in each panel indicates the zero point where z and zphoto coincide. Fourth row: PIT distributions. The y-axis in each panel is truncated at 0.5 for clearer illustration.
between each of the stacked recentred probability densities pΣ (z − zphoto) and the corresponding zspec − zphoto histogram. The vertical dashed line in each panel indicates the zero point where z and zphoto coincide. Fourth row: PIT distributions. The y-axis in each panel is truncated at 0.5 for clearer illustration.
Current usage metrics show cumulative count of Article Views (full-text article views including HTML views, PDF and ePub downloads, according to the available data) and Abstracts Views on Vision4Press platform.
Data correspond to usage on the plateform after 2015. The current usage metrics is available 48-96 hours after online publication and is updated daily on week days.
Initial download of the metrics may take a while.