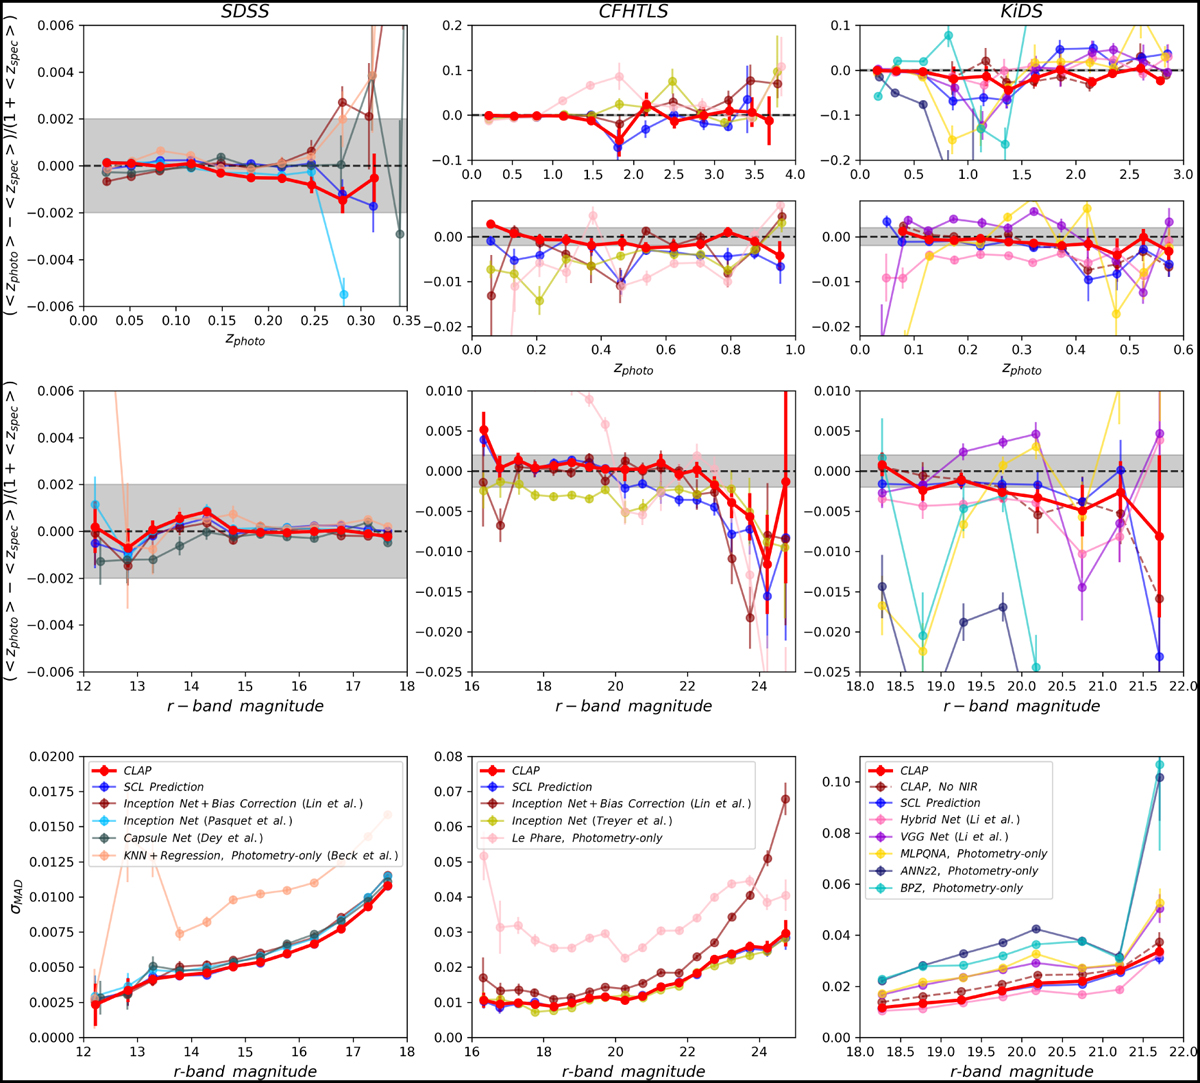
Fig. 6
Download original image
Mean redshift residuals and accuracy of photometric redshift point estimates shown for the SDSS, CFHTLS, and KiDS target samples. The results obtained by CLAP are compared with those produced by other methods, as in Fig. 4. For both CLAP and the SCL prediction, the ensemble of ten probability density estimates are combined using the harmonic mean. Upper panels: mean redshift residuals as a function of photometric redshift zphoto. The error bars are estimated using the root mean square error (RMSE) of residuals in each photometric redshift bin. The requirement for the accuracy of photometric redshift estimation (i.e. |δ<z> | < 0.002) is indicated by the shaded bands. The horizontal dashed lines indicate zero residuals. The results for the CFHTLS and KiDS datasets are shown in both the full and the restricted redshift ranges; the restricted range (i.e. zphoto < 1.0 and zphoto < 0.6, respectively) roughly covers 90% of the full sample for each dataset. For the KiDS dataset, the results produced by ANNZ2 and BPZ are not shown in the restricted range due to large biases. Middle panels: same as the upper panels, but showing mean redshift residuals as a function of r-band magnitude for the full data. Lower panels: σMAD as a function of r-band magnitude. The error bars are estimated using bootstrap.
Current usage metrics show cumulative count of Article Views (full-text article views including HTML views, PDF and ePub downloads, according to the available data) and Abstracts Views on Vision4Press platform.
Data correspond to usage on the plateform after 2015. The current usage metrics is available 48-96 hours after online publication and is updated daily on week days.
Initial download of the metrics may take a while.