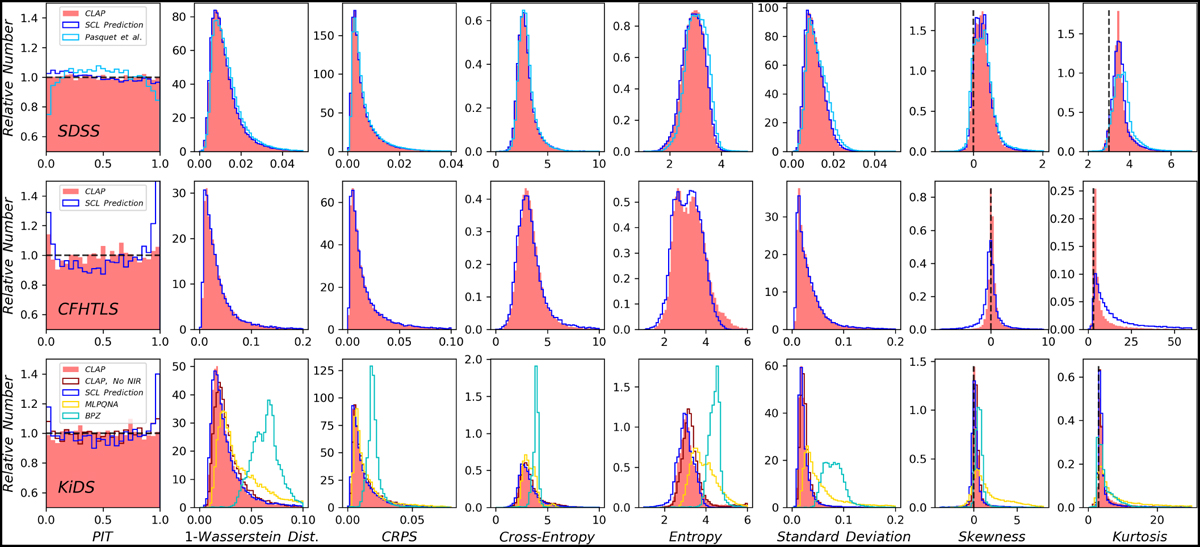
Fig. 5
Download original image
Distributions of summary statistics of photometric redshift probability density estimates illustrated for the SDSS, CFHTLS, and KiDS target samples. Comparison is made among the results from CLAP and the methods for which the probability density estimates are available, as in Fig. 4. The definitions of the shown summary statistics can be found in Table 2. For both CLAP and the SCL prediction, the ensemble of ten probability density estimates are combined using the harmonic mean. For the PIT, the y-axis in each panel is truncated at 0.5 for clearer illustration; the horizontal dashed lines indicate normalised uniform distributions. The PIT distributions produced by MLPQNA and BPZ are dramatically non-flat and are not shown in the figure. For the kurtosis, the vertical dashed lines indicate the value for Gaussian-like distributions (i.e. 3).
Current usage metrics show cumulative count of Article Views (full-text article views including HTML views, PDF and ePub downloads, according to the available data) and Abstracts Views on Vision4Press platform.
Data correspond to usage on the plateform after 2015. The current usage metrics is available 48-96 hours after online publication and is updated daily on week days.
Initial download of the metrics may take a while.